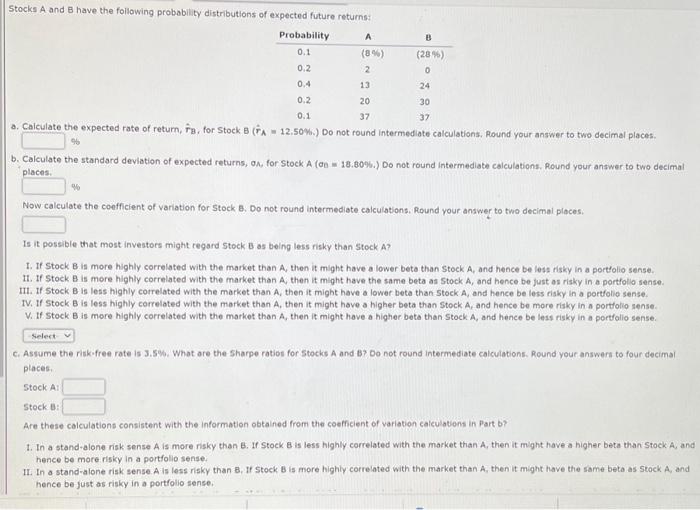
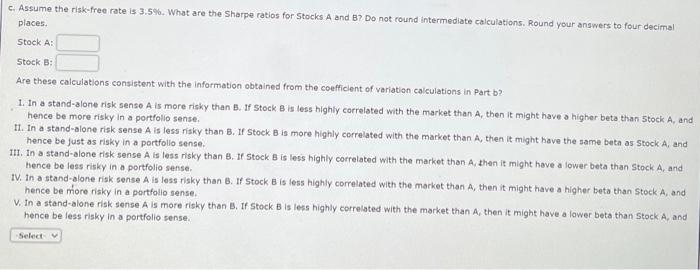
Stocks A and B have the following probability distributions of expected future returns: a. Caiculate the expected rate of return, r^B, for Stock, B(r^A=12,50%.) Do not round intermediate calculations, Pound your answer to two decimal places. b. Calculate the standard deylation of expected returns, o., for Stock A (dE = 1e8. B0\%.) Do not round intermediate calculations. Round your answer to two decimal places. Now calculate the confficient of variation for Stock B. Do not round intermediate calculations. Round your answer to two decimal places. Is it possible that most investors might regard stock B as being less risky than stock A? 1. If Stock B is more highly correlated with the market than A, then it might have a lower beta than stock A, and hence be less risky in a portfolio sense. II. If Stock B is more highly correlated with the market than A, then it might have the same beta as Stock A, and hence be just as risky in a portfollo sense. III. If Stock B is less highly correlated with the market than A, then it might have a lower beta than Stock A, and hence be less risky in a portfolio sense. IV. If Stock B is less highly correlated with the market than A, then it might have a higher beta than Stock A, and hence be more risky in a portfolio sense. V. If stock B is more highly correlated with the market than A, then it might have a higher beta than Stock A, and hence be less risky in a pertfolio sense. c. Assume the risk-free rate is 3.5\%. What are the Sharpe ratios for Stocks A and B? Do not round intermediate calculations. Round your answers to four decimal places. Stock A: Stock B: Are these calculations consistent with the information obtained from the coeficient of variation caleulatiens in Part b? 1. In a stand-alone risk sense A is more risky than B. If Stock B is less highly correlated with the market than A, then it might have a higher beta than Stock A, and hence be more risicy in a portfollo sense. II. In a stand-alone risk sense. A is less risky than B. If stock B is more highly correlated with the market than A, then it might have the same beta as stock A, and hence be just as risky in a portfolio sense. c. Assume the risk-free rate is 3.5\%. What are the Sharpe ratios for stocks A and B? Do not round intermediate calculations. Round your angwers to four decimal places. Stock A: Stock B: Are these calculations consistent with the information obtained from the coefficlent of variation calculations in Part b? 1. In a stand-alone risk sense A is more risky than B. If Stock. B is less highly correlated with the market than A, then it might have a higher beta than 5 tock A, and hence be more risky in a portfolio sense. II. In a stand-alone risk sense A is less risky than B. If Stock. B is more highly correlated with the market than A, then it might have the same beta as Stock A, and hence be just as risky in a portfollo sense. ItI. In a stand-alone risk sense A is less risky than B. If stock B is less highly correlated with the market than A, then it might have a lower beta than Stock A, and hence be less risky in a portfolio sense. IV. In a stand-alone risk sense A is less risky than B. If Stock B is less highly correlated with the market than A, then it might have a higher beta than Stock A, and hence be more risky in a portfolio sense. V. In a stend-alone risk sense A is more risky than B. If Stock B is less highly correlated with the market than A, then it might have a lawer beta than Stock A, and hence be less risky in a portfolio sense