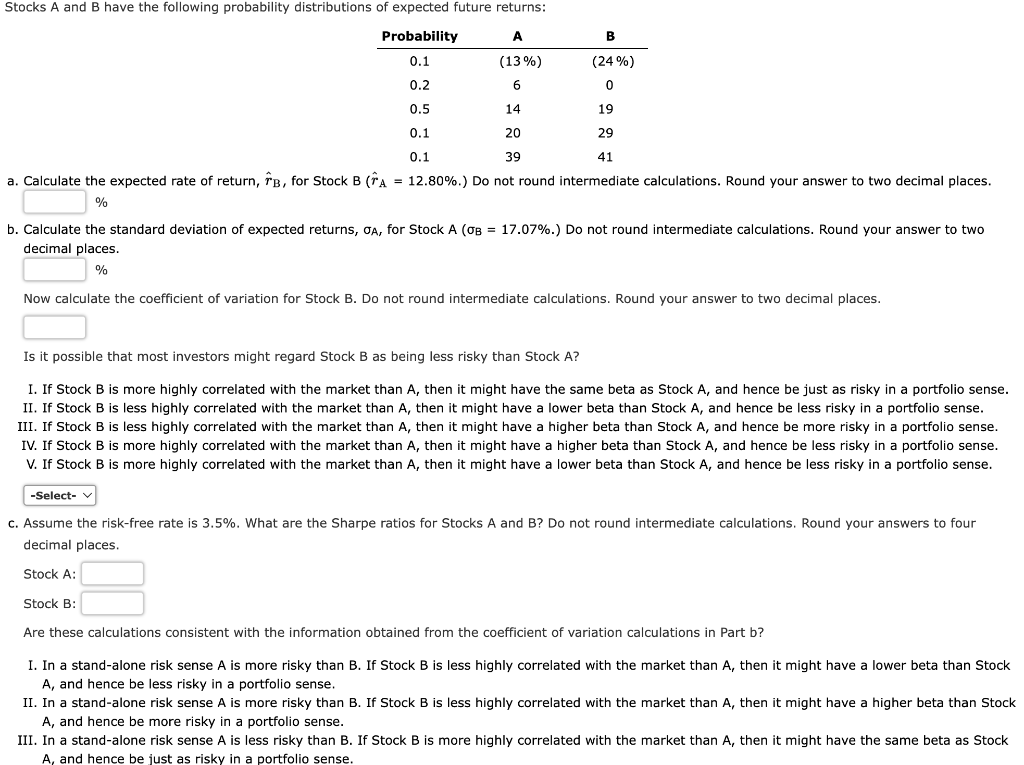
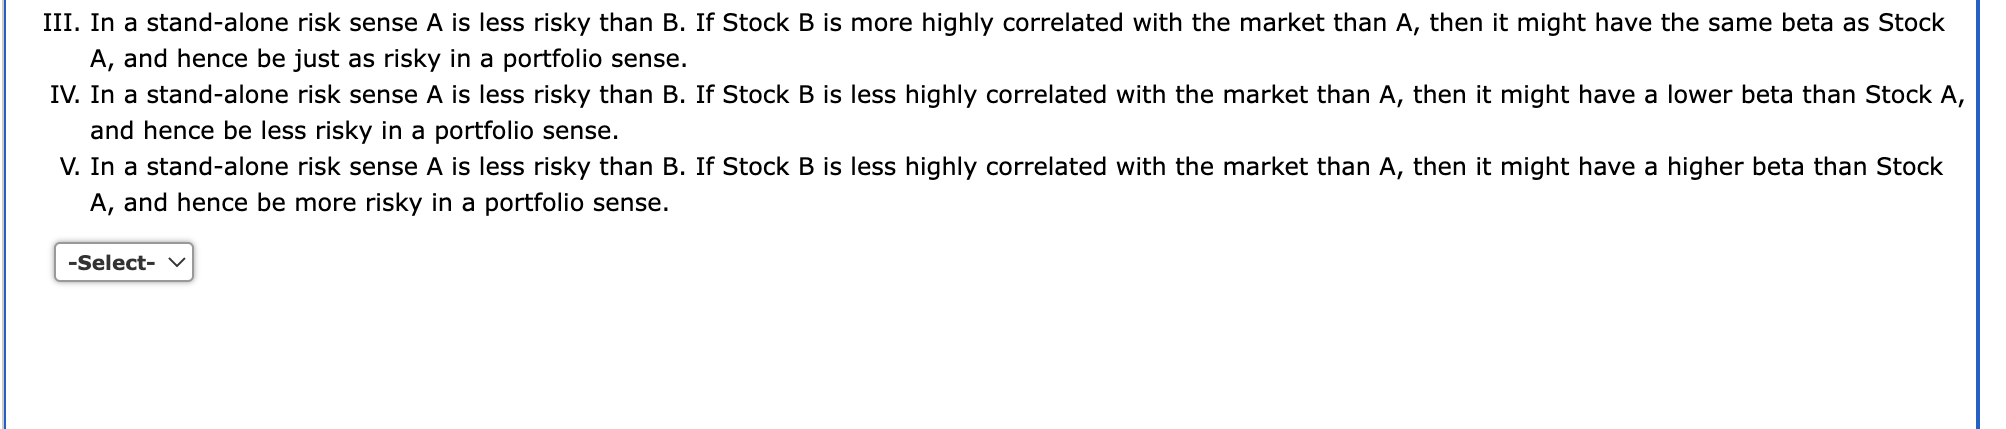
Stocks A and B have the following probability distributions of expected future returns: Probability A B 0.1 (24%) (13%) 6 0.2 0 0.5 14 19 0.1 20 29 0.1 39 41 a. Calculate the expected rate of return, fb, for Stock B (A = 12.80%.) Do not round intermediate calculations. Round your answer to two decimal places. % b. Calculate the standard deviation of expected returns, CA, for Stock A (OB = 17.07%.) Do not round intermediate calculations. Round your answer to two decimal places. % Now calculate the coefficient of variation for Stock B. Do not round intermediate calculations. Round your answer to two decimal places. Is it possible that most investors might regard Stock B as being less risky than Stock A? I. If Stock B is more highly correlated with the market than A, then it might have the same beta as Stock A, and hence be just as risky in a portfolio sense. II. If Stock B is less highly correlated with the market than A, then it might have a lower beta than Stock A, and hence be less risky in a portfolio sense. III. If Stock B is less highly correlated with the market than A, then it might have a higher beta than Stock A, and hence be more risky in a portfolio sense. IV. If Stock B is more highly correlated with the market than A, then it might have a higher beta than Stock A, and hence be less risky in a portfolio sense. V. If Stock B is more highly correlated with the market than A, then it might have lower beta than Stock A, and hence be less risky in a portfolio sense. -Select- C. Assume the risk-free rate is 3.5%. What are the Sharpe ratios for Stocks A and B? Do not round intermediate calculations. Round your answers to four decimal places. Stock A: Stock B: Are these calculations consistent with the information obtained from the coefficient of variation calculations in Part b? I. In a stand-alone risk sense A is more risky than B. If Stock B is less highly correlated with the market than A, then it might have a lower beta than Stock A, and hence be less risky in a portfolio sense. II. In a stand-alone risk sense A is more risky than B. If Stock B is less highly correlated with the market than A, then it might have a higher beta than Stock A, and hence be more risky in a portfolio sense. III. In a stand-alone risk sense A is less risky than B. If Stock B is more highly correlated with the market than A, then it might have the same beta as Stock A, and hence be just as risky in a portfolio sense. III. In a stand-alone risk sense A is less risky than B. If Stock B is more highly correlated with the market than A, then it might have the same beta as Stock A, and hence be just as risky in a portfolio sense. IV. In a stand-alone risk sense A is less risky than B. If Stock B is less highly correlated with the market than A, then it might have a lower beta than Stock A, and hence be less risky in a portfolio sense. V. In a stand-alone risk sense A is less risky than B. If Stock B is less highly correlated with the market than A, then it might have a higher beta than Stock A, and hence be more risky in a portfolio sense. -Select