

Answered step by step
Verified Expert Solution
Question
1 Approved Answer
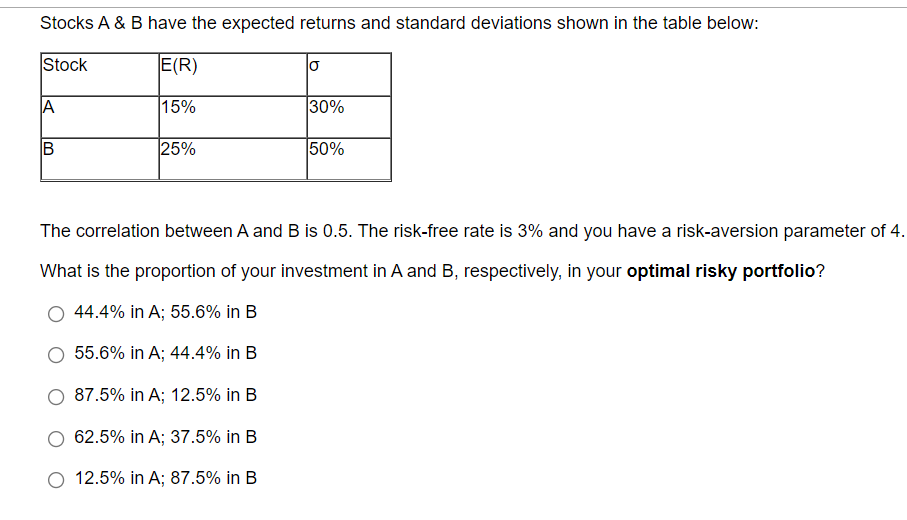
Stocks A & B have the expected returns and standard deviations shown in the table below: Stock E(R) jo A 15% 30% B 25% 50%
Step by Step Solution
There are 3 Steps involved in it
Step: 1

Get Instant Access to Expert-Tailored Solutions
See step-by-step solutions with expert insights and AI powered tools for academic success
Step: 2

Step: 3
Ace Your Homework with AI
Get the answers you need in no time with our AI-driven, step-by-step assistance
Get Started
Options Trading For Beginners How To Generate Predictable Income And Make A Living Without Taking Big Risks Even If You Re A Complete Beginner
Authors: Greg Middleton
1st Edition
979-8866955046