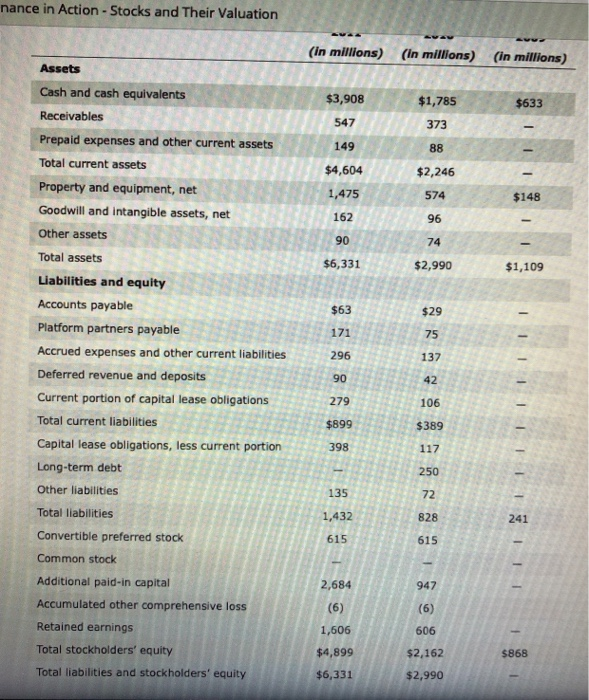
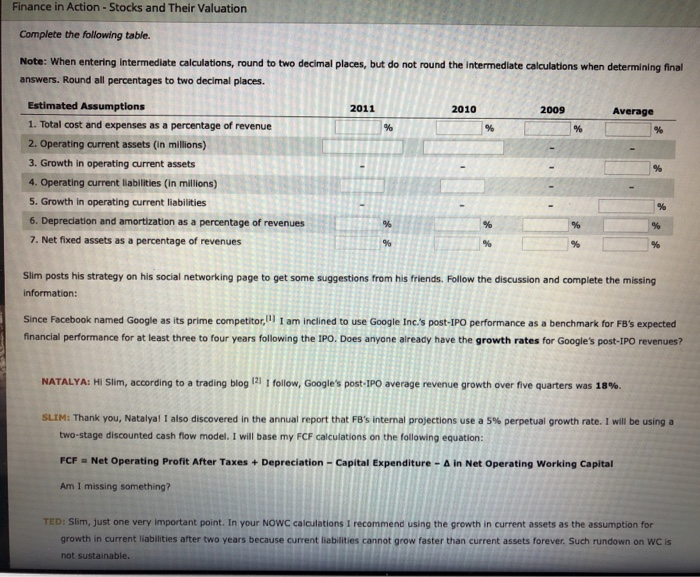
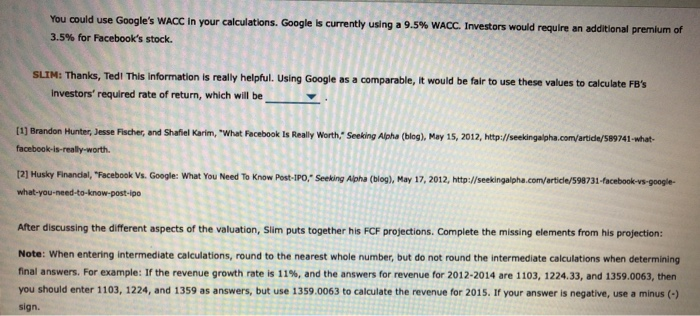
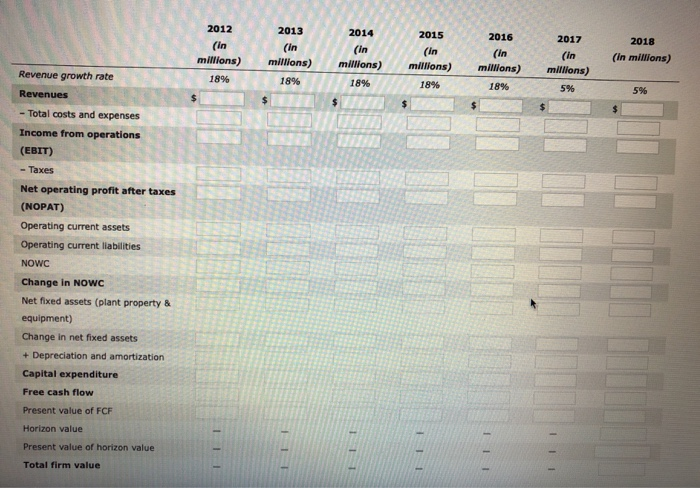
Stocks and Their Valuation
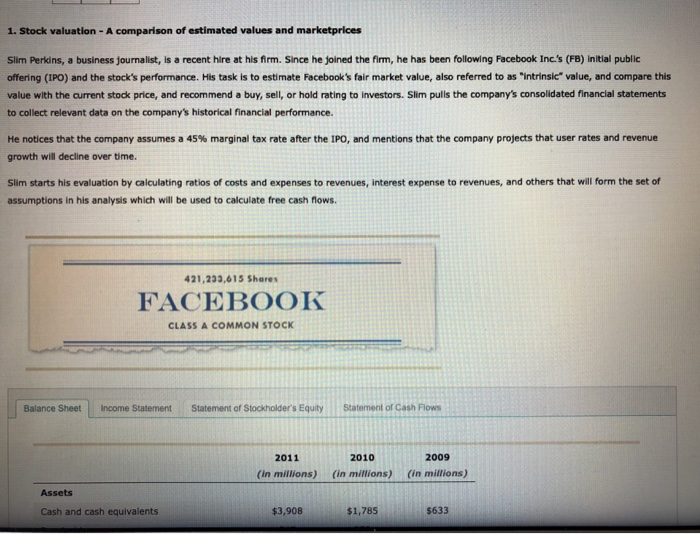
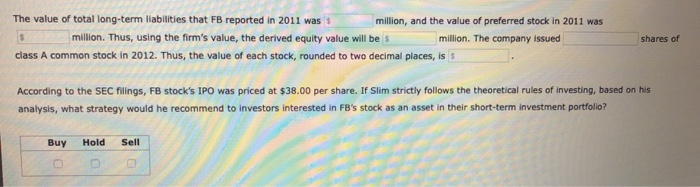
1. Stock valuation - A comparison of estimated values and marketprices Slim Perkins, a business Journalist, is a recent hire at his firm. Since he joined the firm, he has been following Facebook Inc.'s (FB) Initial public offering (IPO) and the stock's performance. His task is to estimate Facebook's fair market value, also referred to as "intrinsic" value, and compare this value with the current stock price, and recommend a buy, sell, or hold rating to investors. Slim pulls the company's consolidated financial statements to collect relevant data on the company's historical financial performance. He notices that the company assumes a 45% marginal tax rate after the IPO, and mentions that the company projects that user rates and revenue growth will decline over time. Slim starts his evaluation by calculating ratios of costs and expenses to revenues, interest expense to revenues, and others that will form the set of assumptions in his analysis which will be used to calculate free cash flows. 421,233,615 Shares FACEBOOK CLASS A COMMON STOCK Balance Sheet Income Statement Statement of Stockholder's Equity Statement of Cash Flows 2011 (in millions) 2010 (in millions) 2009 (in millions) Assets Cash and cash equivalents $3,908 $1,785 $633 nance in Action - Stocks and Their Valuation (in millions) (in millions) (in millions) $3,908 $633 547 149 $1,785 373 88 $2,246 574 96 $4,604 1,475 $148 162 90 74 $6,331 $2,990 $1,109 Assets Cash and cash equivalents Receivables Prepaid expenses and other current assets Total current assets Property and equipment, net Goodwill and intangible assets, net Other assets Total assets Liabilities and equity Accounts payable Platform partners payable Accrued expenses and other current liabilities Deferred revenue and deposits Current portion of capital lease obligations Total current liabilities Capital lease obligations, less current portion Long-term debt Other liabilities Total liabilities Convertible preferred stock Common stock Additional paid-in capital Accumulated other comprehensive loss Retained earnings Total stockholders' equity Total liabilities and stockholders' equity IIIIIIIIII 135 1,432 615 2,684 (6) 1,606 947 (6) 606 $2,162 $2,990 $4,899 $868 $6,331 Finance in Action - Stocks and Their Valuation Complete the following table. Note: When entering Intermediate calculations, round to two decimal places, but do not round the intermediate calculations when determining final answers. Round all percentages to two decimal places. 2010 2009 Average Estimated Assumptions 1. Total cost and expenses as a percentage of revenue 2. Operating current assets (in millions) 3. Growth in operating current assets 4. Operating current liabilities (in millions) 5. Growth in operating current liabilities 6. Depreciation and amortization as a percentage of revenue 7. Net fixed assets as a percentage of revenues Slim posts his strategy on his social networking page to get some suggestions from his friends. Follow the discussion and complete the missing information: Since Facebook named Google as its prime competitor, I am inclined to use Google Inc.'s post-IPO performance as a benchmark for FB's expected financial performance for at least three to four years following the IPO. Does anyone already have the growth rates for Google's post-IPO revenues? NATALYA: Hi Slim, according to a trading blog - I follow, Google's post-IPO average revenue growth over five quarters was 18%. SLIM: Thank you, Natalyal I also discovered in the annual report that FB's internal projections use a 5% perpetual growth rate. I will be using a two-stage discounted cash flow model. I will base my FCF calculations on the following equation: FCF Net Operating Profit After Taxes + Depreciation - Capital Expenditure - A in Net Operating Working Capital Am I missing something? TED: Slim, just one very important point. In your NOWC calculations I recommend using the growth in current assets as the assumption for growth in current liabilities after two years because current liabilities cannot grow faster than current assets forever. Such rundown on WCIS not sustainable. You could use Google's WACC in your calculations. Google is currently using a 9.5% WACC. Investors would require an additional premium of 3.5% for Facebook's stock. SLIM: Thanks, Tedi This Information is really helpful. Using Google as a comparable, it would be fair to use these values to calculate FB's Investors' required rate of return, which will be [1] Brandon Hunter, Jesse Fischer, and Shafiel Karim, "What Facebook Is Really Worth." Seeking Alpha (blog), May 15, 2012, http://seekinga pha.com/artide/589741 what facebook-is-really worth. [2] Husky Financial, "Facebook Vs. Google: What You Need To Know Post-IPO," Seeking Alpha (blog), May 17, 2012, http://seekingalpha.com/article/598731-facebook-vs-google- what-you-need-to-know-post-ipo After discussing the different aspects of the valuation, Slim puts together his FCF projections. Complete the missing elements from his projection: Note: When entering intermediate calculations, round to the nearest whole number, but do not round the intermediate calculations when determining final answers. For example: If the revenue growth rate is 11%, and the answers for revenue for 2012-2014 are 1103, 1224.33, and 1359.0063, then you should enter 1103, 1224, and 1359 as answers, but use 1359.0063 to calculate the revenue for 2015. If your answer is negative, use a minus (-) sign. 2014 2012 (in millions) 18% 2013 (in millions) 18% 2016 (in millions) 18% 2015 (in millions) 18% 2017 (in millions) 5% 2018 (in millions) millions) 18% Revenue growth rate Revenues - Total costs and expenses Income from operations (EBIT) - Taxes Net operating profit after taxes (NOPAT) Operating current assets Operating current liabilities NOWC Change in NOWC Net fixed assets (plant property & equipment) Change in net fixed assets + Depreciation and amortization Capital expenditure Free cash flow Present value of FCF Horizon value Present value of horizon value Total firm value The value of total long-term liabilities that FB reported in 2011 wass million, and the value of preferred stock in 2011 was million. Thus, using the firm's value, the derived equity value will be $ million. The company issued class A common stock in 2012. Thus, the value of each stock, rounded to two decimal places, is $ shares of According to the SEC filings, FB stock's IPO was priced at $38.00 per share. If Slim strictly follows the theoretical rules of investing, based on his analysis, what strategy would he recommend to investors interested in FB's stock as an asset in their short-term investment portfolio? Buy 0 Hold 0 Sell 0 1. Stock valuation - A comparison of estimated values and marketprices Slim Perkins, a business Journalist, is a recent hire at his firm. Since he joined the firm, he has been following Facebook Inc.'s (FB) Initial public offering (IPO) and the stock's performance. His task is to estimate Facebook's fair market value, also referred to as "intrinsic" value, and compare this value with the current stock price, and recommend a buy, sell, or hold rating to investors. Slim pulls the company's consolidated financial statements to collect relevant data on the company's historical financial performance. He notices that the company assumes a 45% marginal tax rate after the IPO, and mentions that the company projects that user rates and revenue growth will decline over time. Slim starts his evaluation by calculating ratios of costs and expenses to revenues, interest expense to revenues, and others that will form the set of assumptions in his analysis which will be used to calculate free cash flows. 421,233,615 Shares FACEBOOK CLASS A COMMON STOCK Balance Sheet Income Statement Statement of Stockholder's Equity Statement of Cash Flows 2011 (in millions) 2010 (in millions) 2009 (in millions) Assets Cash and cash equivalents $3,908 $1,785 $633 nance in Action - Stocks and Their Valuation (in millions) (in millions) (in millions) $3,908 $633 547 149 $1,785 373 88 $2,246 574 96 $4,604 1,475 $148 162 90 74 $6,331 $2,990 $1,109 Assets Cash and cash equivalents Receivables Prepaid expenses and other current assets Total current assets Property and equipment, net Goodwill and intangible assets, net Other assets Total assets Liabilities and equity Accounts payable Platform partners payable Accrued expenses and other current liabilities Deferred revenue and deposits Current portion of capital lease obligations Total current liabilities Capital lease obligations, less current portion Long-term debt Other liabilities Total liabilities Convertible preferred stock Common stock Additional paid-in capital Accumulated other comprehensive loss Retained earnings Total stockholders' equity Total liabilities and stockholders' equity IIIIIIIIII 135 1,432 615 2,684 (6) 1,606 947 (6) 606 $2,162 $2,990 $4,899 $868 $6,331 Finance in Action - Stocks and Their Valuation Complete the following table. Note: When entering Intermediate calculations, round to two decimal places, but do not round the intermediate calculations when determining final answers. Round all percentages to two decimal places. 2010 2009 Average Estimated Assumptions 1. Total cost and expenses as a percentage of revenue 2. Operating current assets (in millions) 3. Growth in operating current assets 4. Operating current liabilities (in millions) 5. Growth in operating current liabilities 6. Depreciation and amortization as a percentage of revenue 7. Net fixed assets as a percentage of revenues Slim posts his strategy on his social networking page to get some suggestions from his friends. Follow the discussion and complete the missing information: Since Facebook named Google as its prime competitor, I am inclined to use Google Inc.'s post-IPO performance as a benchmark for FB's expected financial performance for at least three to four years following the IPO. Does anyone already have the growth rates for Google's post-IPO revenues? NATALYA: Hi Slim, according to a trading blog - I follow, Google's post-IPO average revenue growth over five quarters was 18%. SLIM: Thank you, Natalyal I also discovered in the annual report that FB's internal projections use a 5% perpetual growth rate. I will be using a two-stage discounted cash flow model. I will base my FCF calculations on the following equation: FCF Net Operating Profit After Taxes + Depreciation - Capital Expenditure - A in Net Operating Working Capital Am I missing something? TED: Slim, just one very important point. In your NOWC calculations I recommend using the growth in current assets as the assumption for growth in current liabilities after two years because current liabilities cannot grow faster than current assets forever. Such rundown on WCIS not sustainable. You could use Google's WACC in your calculations. Google is currently using a 9.5% WACC. Investors would require an additional premium of 3.5% for Facebook's stock. SLIM: Thanks, Tedi This Information is really helpful. Using Google as a comparable, it would be fair to use these values to calculate FB's Investors' required rate of return, which will be [1] Brandon Hunter, Jesse Fischer, and Shafiel Karim, "What Facebook Is Really Worth." Seeking Alpha (blog), May 15, 2012, http://seekinga pha.com/artide/589741 what facebook-is-really worth. [2] Husky Financial, "Facebook Vs. Google: What You Need To Know Post-IPO," Seeking Alpha (blog), May 17, 2012, http://seekingalpha.com/article/598731-facebook-vs-google- what-you-need-to-know-post-ipo After discussing the different aspects of the valuation, Slim puts together his FCF projections. Complete the missing elements from his projection: Note: When entering intermediate calculations, round to the nearest whole number, but do not round the intermediate calculations when determining final answers. For example: If the revenue growth rate is 11%, and the answers for revenue for 2012-2014 are 1103, 1224.33, and 1359.0063, then you should enter 1103, 1224, and 1359 as answers, but use 1359.0063 to calculate the revenue for 2015. If your answer is negative, use a minus (-) sign. 2014 2012 (in millions) 18% 2013 (in millions) 18% 2016 (in millions) 18% 2015 (in millions) 18% 2017 (in millions) 5% 2018 (in millions) millions) 18% Revenue growth rate Revenues - Total costs and expenses Income from operations (EBIT) - Taxes Net operating profit after taxes (NOPAT) Operating current assets Operating current liabilities NOWC Change in NOWC Net fixed assets (plant property & equipment) Change in net fixed assets + Depreciation and amortization Capital expenditure Free cash flow Present value of FCF Horizon value Present value of horizon value Total firm value The value of total long-term liabilities that FB reported in 2011 wass million, and the value of preferred stock in 2011 was million. Thus, using the firm's value, the derived equity value will be $ million. The company issued class A common stock in 2012. Thus, the value of each stock, rounded to two decimal places, is $ shares of According to the SEC filings, FB stock's IPO was priced at $38.00 per share. If Slim strictly follows the theoretical rules of investing, based on his analysis, what strategy would he recommend to investors interested in FB's stock as an asset in their short-term investment portfolio? Buy 0 Hold 0 Sell 0