Answered step by step
Verified Expert Solution
Question
1 Approved Answer
Studant Tohlo Instructor Table Enrollment Table begin{tabular}{|l|} hline Classes hline . Class ID Class Name Price(per class) Start Date
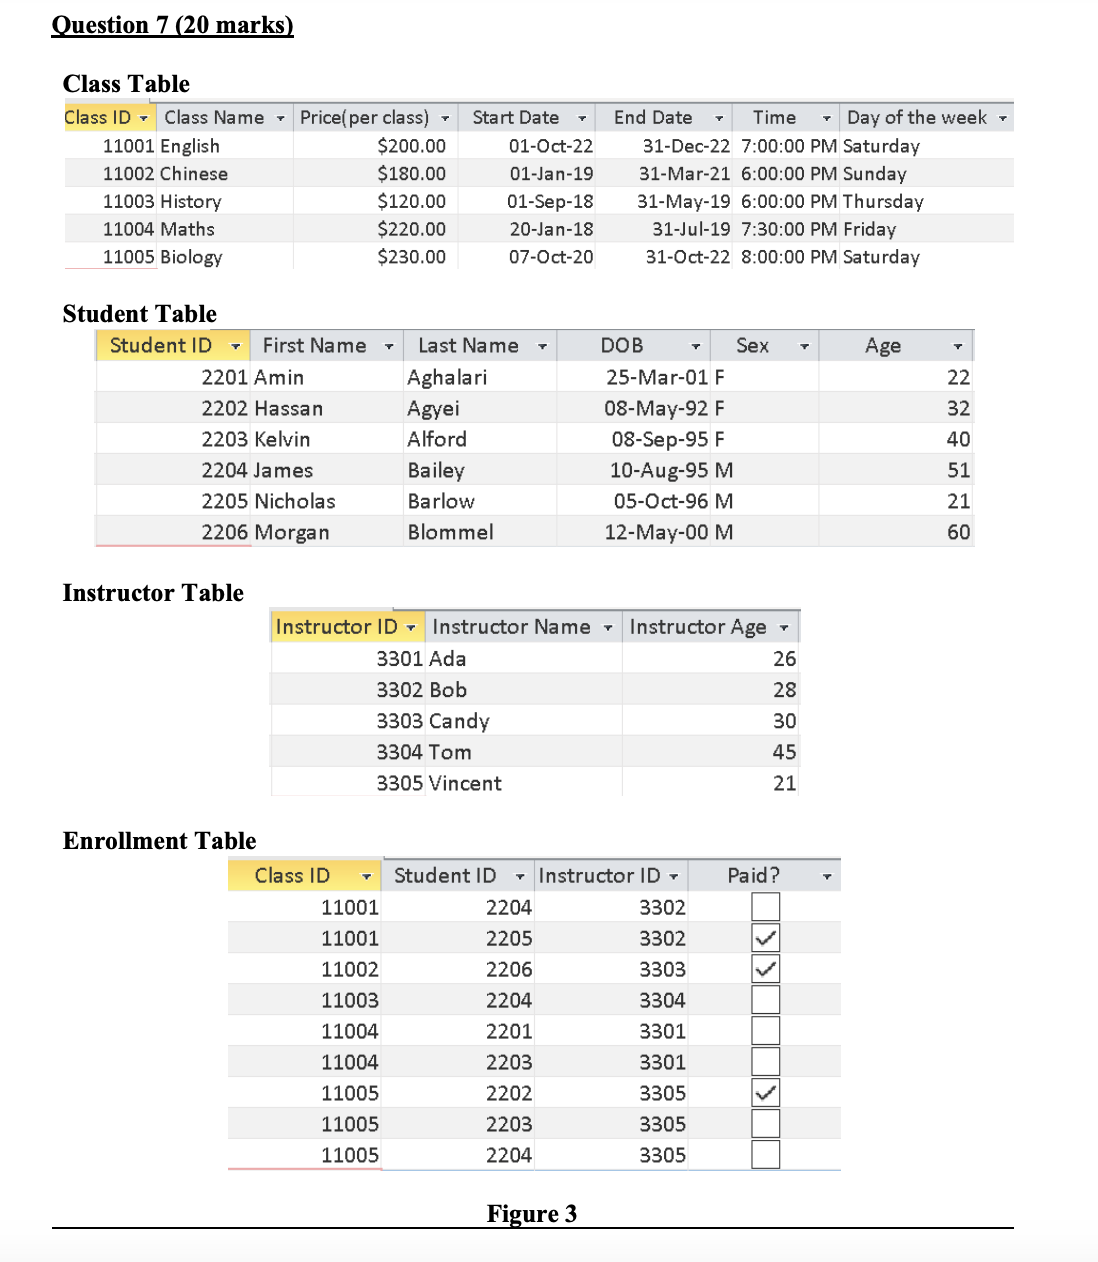
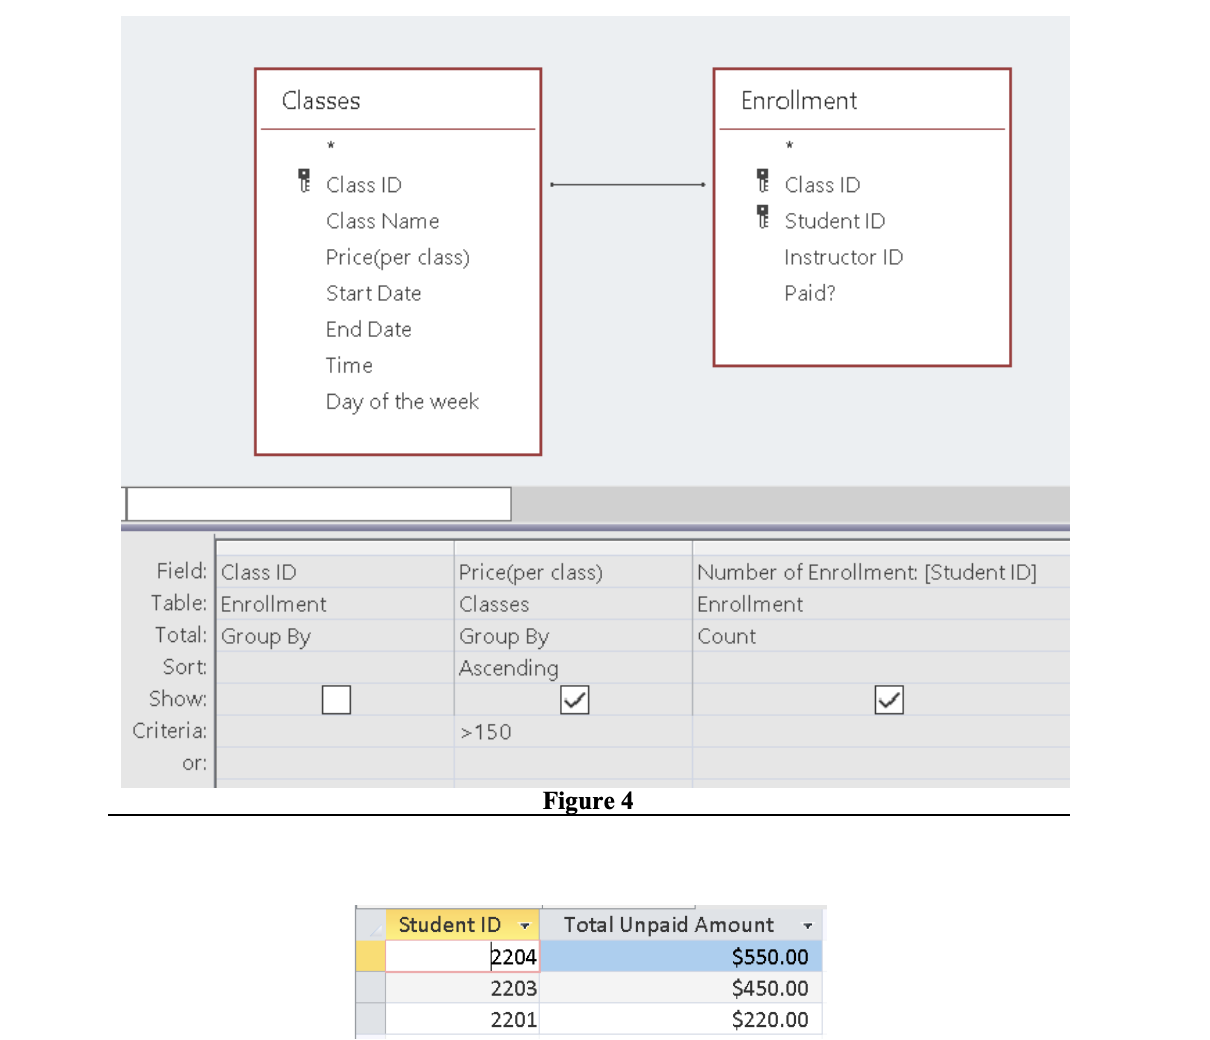
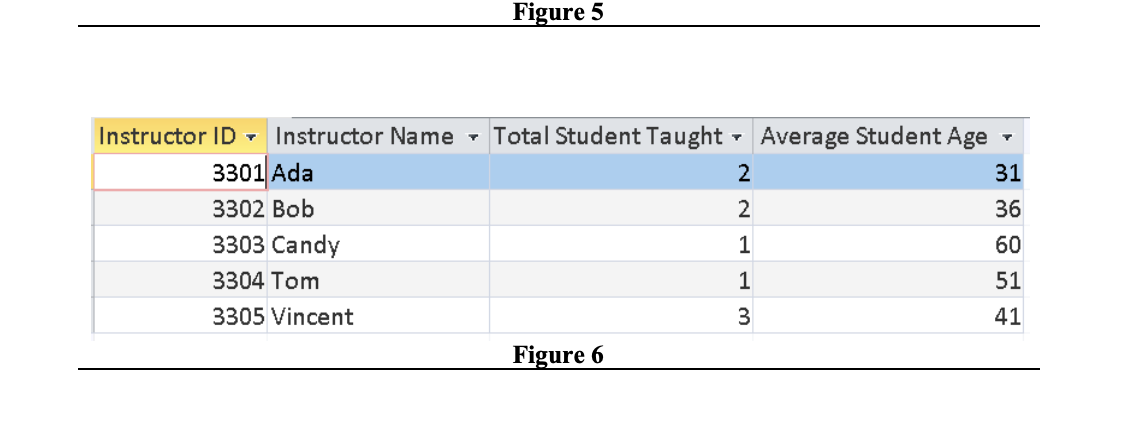
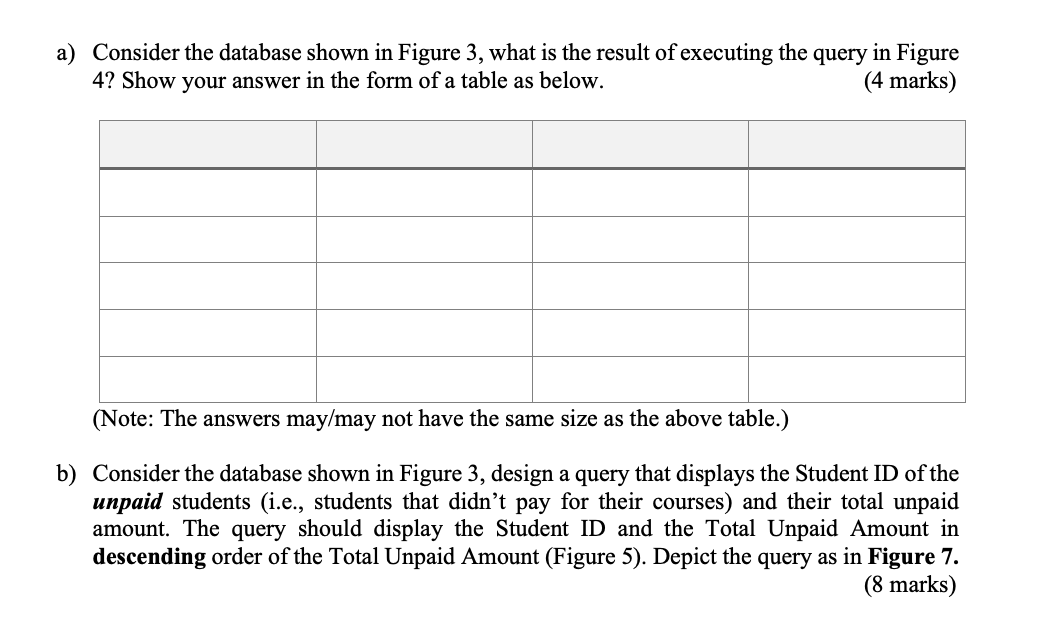
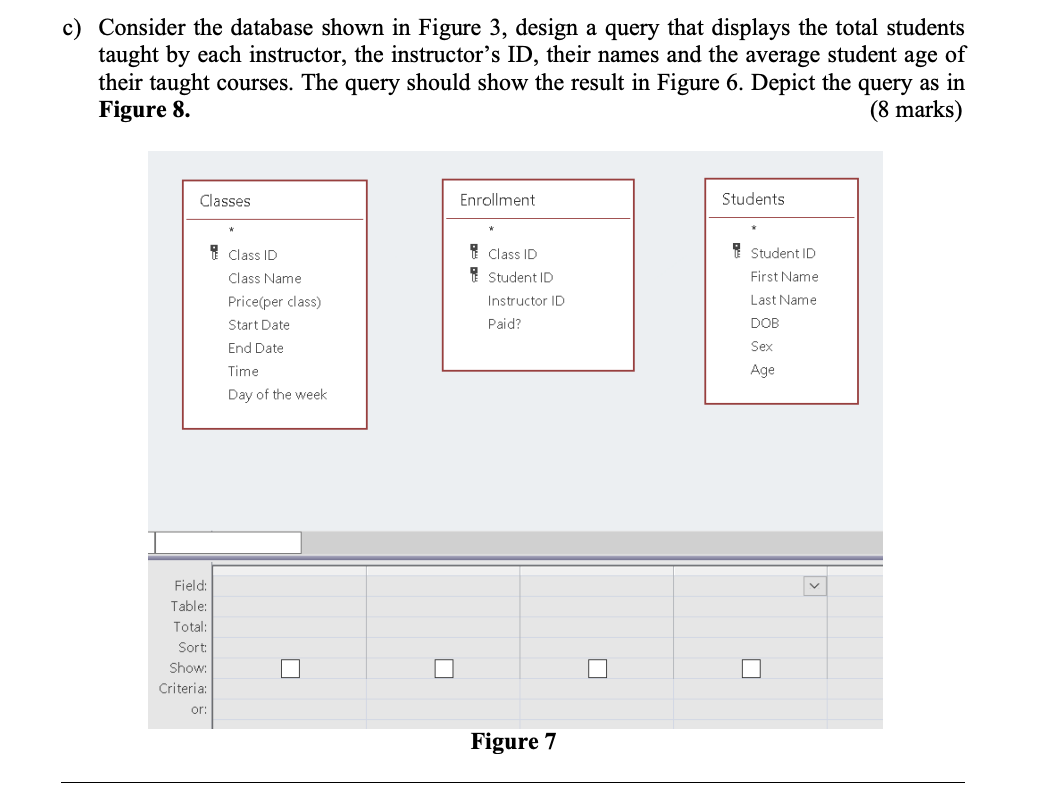
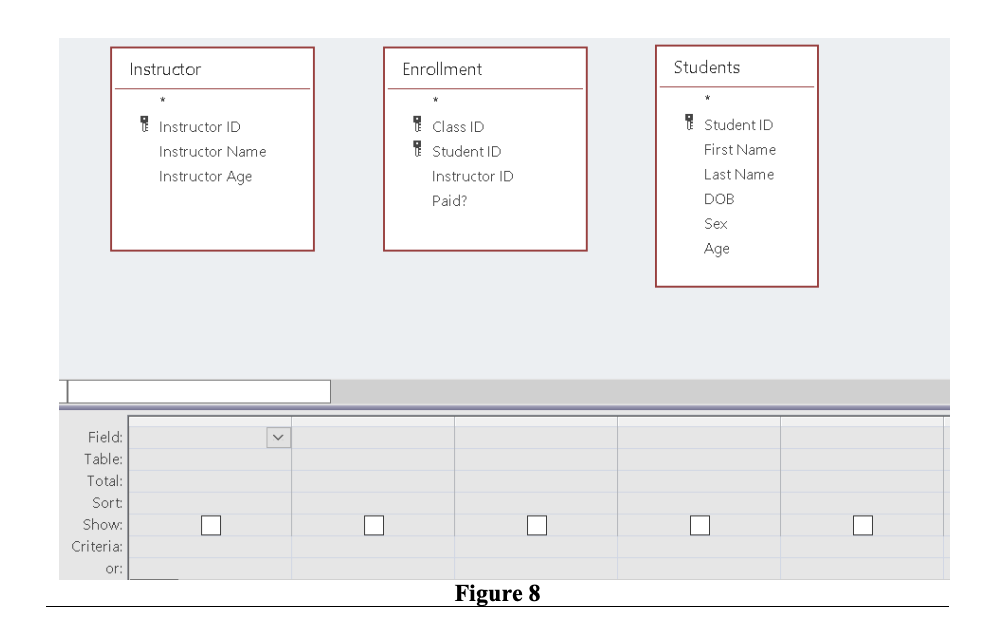 Studant Tohlo Instructor Table Enrollment Table \begin{tabular}{|l|} \hline Classes \\ \hline \\ . Class ID \\ Class Name \\ Price(per class) \\ Start Date \\ End Date \\ Time \\ Day of the week \\ \hline \end{tabular} \begin{tabular}{r|l|l|l|} \hline \multicolumn{2}{|l|}{} & & \\ \hline Field: & Class ID & Price(per class) & Number of Enrollment: [Student ID] \\ Table: & Enrollment & Classes & Enrollment \\ Total: & Group By & Group By & Count \\ Sort: & & Ascending & \\ Show: & & >150 & \\ Criteria: & & & \\ or: & & & \\ \hline \end{tabular} Figure 4 \begin{tabular}{|r|r|} \hline Student ID & Total Unpaid Amount \\ \hline 2204 & $550.00 \\ \hline 2203 & $450.00 \\ \hline 2201 & $220.00 \\ \hline \end{tabular} Figure 5 \begin{tabular}{|c|c|c|c|} \hline Instructor ID - & Instructor Name - & Total Student Taught & Average Student Age - \\ \hline 3301 & Ada & 2 & 31 \\ \hline 3302 & 2 Bob & 2 & 36 \\ \hline 3303 & 3 Candy & 1 & 60 \\ \hline 3304 & Tom & 1 & 51 \\ \hline 3305 & 5 Vincent & 3 & 41 \\ \hline \multicolumn{4}{|c|}{ Figure 6} \\ \hline \end{tabular} a) Consider the database shown in Figure 3, what is the result of executing the query in Figure 4 ? Show your answer in the form of a table as below. (4 marks) (Note: The answers may/may not have the same size as the above table.) b) Consider the database shown in Figure 3, design a query that displays the Student ID of the unpaid students (i.e., students that didn't pay for their courses) and their total unpaid amount. The query should display the Student ID and the Total Unpaid Amount in descending order of the Total Unpaid Amount (Figure 5). Depict the query as in Figure 7. (8 marks) c) Consider the database shown in Figure 3, design a query that displays the total students taught by each instructor, the instructor's ID, their names and the average student age of their taught courses. The query should show the result in Figure 6. Depict the query as in Figure 8. (8 marks) \begin{tabular}{|l|} \hline \multicolumn{1}{|l|}{ Classes } \\ \hline * \\ \hline Class ID \\ Class Name \\ Price(per class) \\ Start Date \\ End Date \\ Time \\ Day of the week \\ \hline \end{tabular} \begin{tabular}{|c|} \hline Enrollment \\ \hline \multirow{2}{*}{} \\ Class ID \\ Student ID \\ Instructor ID \\ Paid? \\ \hline \end{tabular} \begin{tabular}{|l|} \hline Instructor \\ \hline * \\ Instructor ID \\ Instructor Name \\ Instructor Age \\ \\ \hline \end{tabular} \begin{tabular}{|c|} \hline Enrollment \\ \hline \multicolumn{1}{|c|}{} \\ \hline Class ID \\ Student ID \\ Instructor ID \\ Paid? \\ \hline \end{tabular} \begin{tabular}{|c|c|} \hline \multicolumn{2}{|c|}{ Students } \\ \hline & \\ \hline & Student ID \\ \hline & First Name \\ \hline & Last Name \\ \hline & DOB \\ \hline & Sex \\ \hline & Age \\ \hline \end{tabular} \begin{tabular}{r|r} & Field: \\ Table: \\ Total: \\ Sort: \\ Show: \\ Criteria: \\ or: \end{tabular} Figure 8
 Step by Step Solution
There are 3 Steps involved in it
Step: 1

Get Instant Access to Expert-Tailored Solutions
See step-by-step solutions with expert insights and AI powered tools for academic success
Step: 2

Step: 3

Ace Your Homework with AI
Get the answers you need in no time with our AI-driven, step-by-step assistance
Get Started


