Answered step by step
Verified Expert Solution
Question
1 Approved Answer
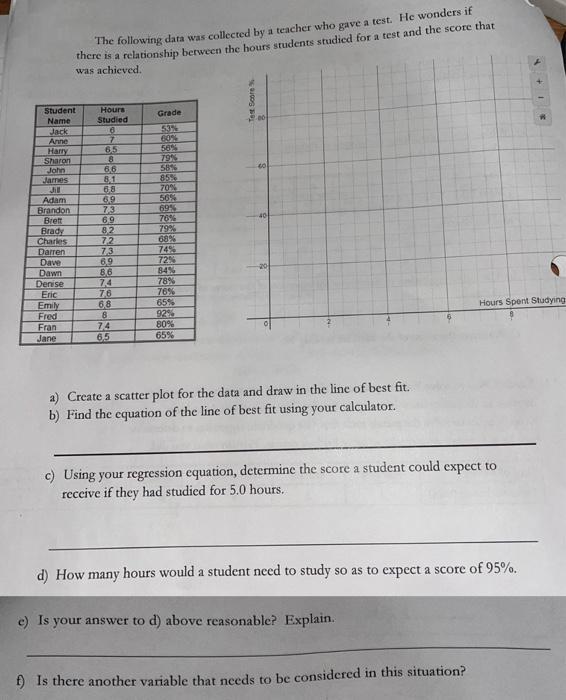
Student Name Jack Anne Harry Sharon John James Jill Adam Brandon Brett Brady Charles Darren The following data was collected by a teacher who

Student Name Jack Anne Harry Sharon John James Jill Adam Brandon Brett Brady Charles Darren The following data was collected by a teacher who gave a test. He wonders if there is a relationship between the hours students studied for a test and the score that was achieved. Dave Dawn Denise Eric Emily Fred Fran Jane Hours Studied 6 7 65 8 6.6 8.1 6.8 69 7,3 6.9 8,2 72 73 6,9 86 7,4 7,6 68 8 74 6,5 Grade 53% 60% 56% 79% 58% 85% 70% 56% 69% 76% 79% 68% 74% 72% 84% 78% 76% 65% 92% 80% 65% Test Score % a) Create a scatter plot for the data and draw in the line of best fit. b) Find the equation of the line of best fit using your calculator. c) Using your regression equation, determine the score a student could expect to receive if they had studied for 5.0 hours. d) How many hours would a student need to study so as to expect a score of 95%. e) Is your answer to d) above reasonable? Explain. Hours Spent Studying f) Is there another variable that needs to be considered in this situation? *
Step by Step Solution
★★★★★
3.45 Rating (161 Votes )
There are 3 Steps involved in it
Step: 1

Get Instant Access to Expert-Tailored Solutions
See step-by-step solutions with expert insights and AI powered tools for academic success
Step: 2

Step: 3

Ace Your Homework with AI
Get the answers you need in no time with our AI-driven, step-by-step assistance
Get Started


