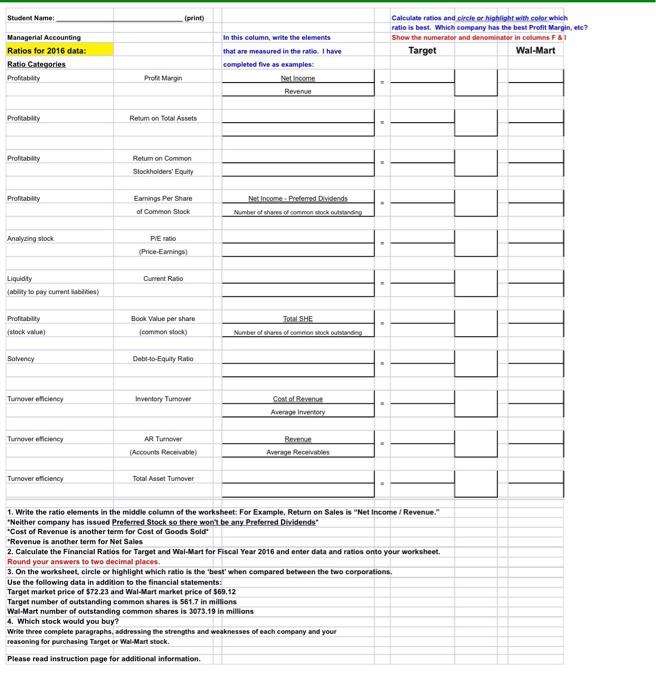
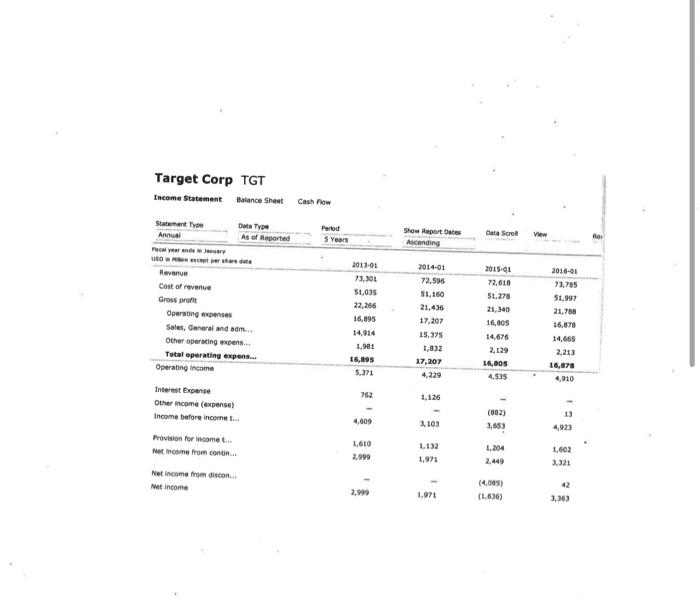
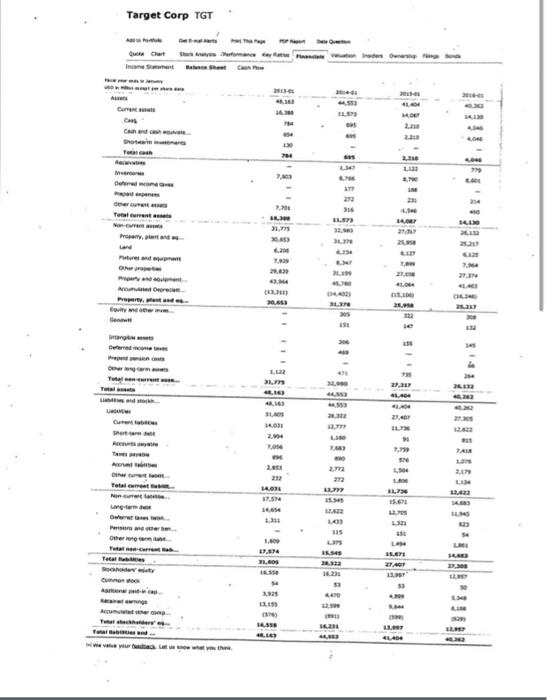
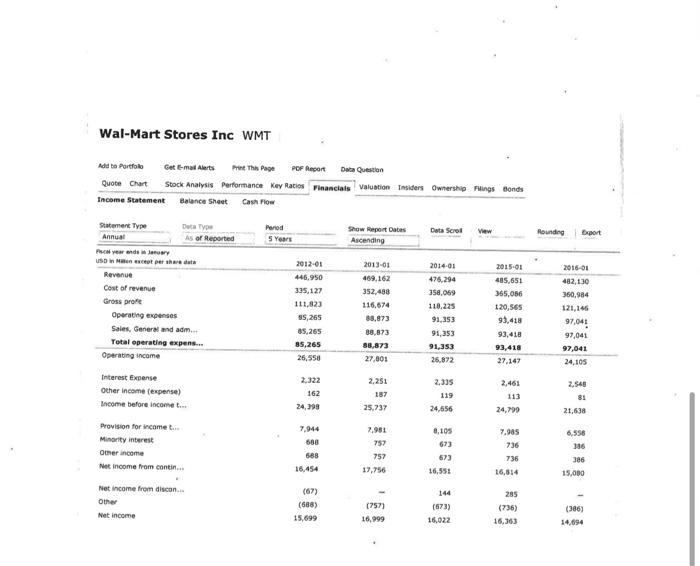
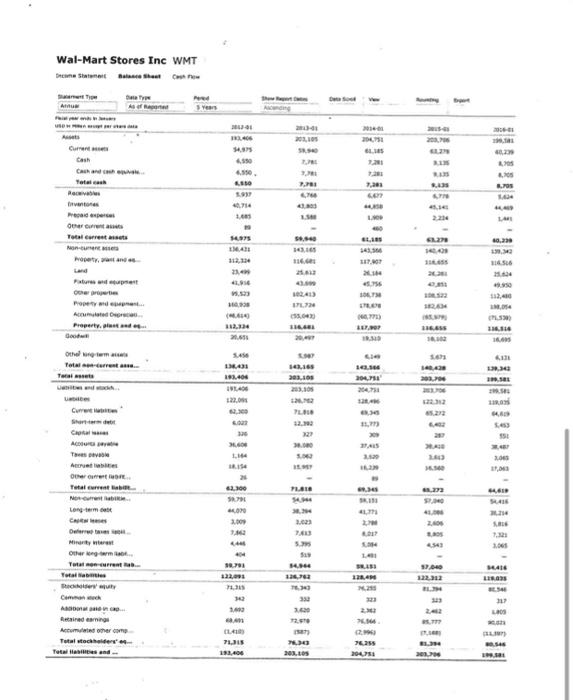
Student Name: (print) Calculate ratios and circles highlight with color which ratio is best. Which company has the best Profit Margin, etc? Show the numerator and denominator in columns F&1 Target Wal-Mart Managerial Accounting Ratios for 2016 data: Ratio Categories Profitability In this column write the elements that are measured in the ratio. I have completed five as examples: Net income Revenue Prof Margin Profitability Retum on Total Assets Profitability Retum on Common Stockholders' Equity Profitability Earnings Per Share of Common Stock Net Income Prstened Dividend Number of the common shocking Analysing stock PE mato (Price-Earnings Current Ratio Liquidity (ability to pay current abilities) Profitability (stock ile) Book Value per share common stock TOSHE Number of shares of de Solvency Debt-to-Equity Ratio Turnover eiciency Inventory Turnover Cost of Revenue Average Inventory Turnover ciency AR Turnover (Accounts Receivable) Rev Average Receivables Turnover oficiency Total Asset Tumover 1. Write the ratio elements in the middle column of the worksheet: For example, Return on Sales is "Net Income / Revenue." "Neither company has issued Preferred Stock so there won't be any Preferred Dividends' "Cost of Revenue is another term for Cost of Goods Sold "Revenue is another term for Net Sales 2. Calculate the Financial Ratios for Target and Wal-Mart for Fiscal Year 2016 and enter data and ratios onto your worksheet. Round your answers to two decimal places 3. On the worksheet circle or highlight which ratio is the best when compared between the two corporations, Use the following data in addition to the financial statements: Target market price of $72.23 and Wal-Mart market price of $69,12 Target number of outstanding common shares is 561.7 in millions Wal-Mart number of outstanding common shares is 3073.19 in millions 4. Which stock would you buy? Write three complete paragraphs, addressing the strengths and weaknesses of each company and your reasoning for purchasing Target or Wal-Mart stock. Please read instruction page for additional information. Target Corp TGT Income Statement Balance Sheet Cash Flow Statement Type Annual helyear ende Dua Type As of Reported Period Data Scroll Show portato Ascending View 5 Years Revenue Cost of revenue Gross profit Operating expenses Sales, General and adm. Other operating expens... Total operating expens... Operating income 2011-01 73,301 51,035 22,216 16,095 14,914 1,981 16,095 5.371 2014-01 72.596 51,160 21,436 17.207 2015-01 72,618 51.278 21,340 16,005 14,676 2129 16,aos 4,535 2016-01 73.785 51.997 21,780 16,870 14,665 2,213 16,878 4,910 15.375 1,832 17,207 4,229 762 1.126 Interest Expense Other income (expense) Income before income 4,609 3.103 (882) 3,653 13 4,923 Provision for income t.. Net income from contin... 1,610 2,999 1.132 1,971 1,204 2.449 1,602 3.321 Nat income from discon Net Income 2. 1.971 (4,005) (1,636) 3,363 Target Corp TGT Income Sweet Base Sheet Current Ches 1413 Totalcash Rece 1. 744 ET Delerde BY 4.14 Total current 316 11.873 32 21,7 Pry Fotoren 20 . 22. 7. 2002 42 C) 20.05 Andere Property and 2. METE SO 34 . 4,16 4,16 31.03 14.00 2 2014 Eele 28. Start LIO 1 9 2,790 2.05 272 Ow Total hancuran unter der 7 LIN 1242 37.594 . 2. Personer Der er Tuta correntes SH US 5 LE 1. 17.578 11.40 IETE 22.07 1ST Como os A 32 16.231 59 40 3.925 Tutte 376 14.550 8.16 1 CL Wal-Mart Stores Inc WMT Add to Portfolio Get e-mail Alerts Print This Page POF Report Data Question Quote Chart Stock Analysis Performance Key Racios Financials Valuation Insiders Ownership Filings Bonds Income Statement Balance Sheet Cash Flow Period 5 Years Data Scroll View Show Report Dates Ascending Rounding Export 2016-01 Statement Type Duta Type Annual As of Reported Pemands USD Men et par the Revenue Cost of revenue Gross profe Operating expenses Sales, General and adm.. Total operating expens... Operating income 2012-01 446,950 335,127 111,823 55,265 85,265 85,265 26,550 2013-01 469,162 352,488 116,674 88,873 38,873 88,873 27,000 2014-01 476,294 358,069 110,225 91.153 91,353 91,353 26,872 2015.01 485,651 365,056 120,565 93,418 93,418 93,418 27,147 482,130 360,984 121.145 97,041 97,041 97,041 24,105 2,461 Interest Expense Other income (expense) Income before income t... 2.322 162 24,99 2.251 187 25.737 2,335 119 24,656 2.540 81 21,638 24,799 8,105 Provision for income Minority interest Omer income Net Income from contin... 2,901 757 7,944 688 688 16.454 673 673 16,551 757 7.985 736 736 16,814 6,556 386 386 17,756 15,000 Net income from discon... Other Net Income (67) (688) 15,699 (757) 16,999 (673) 16,022 285 (736) 16,363 (386) 14,094 Wal-Mart Stores Inc WMT Dean State Show Chow ! the Afa ce AM 1 SY 20,105 10 1.13 54.575 4.590 Cash Chand Totalca News the 2.05 . . LO 7. s. Ordre Total carrers Ron 58.8 6,13 14,50 10.230 15, 1.56 1166 21. 5.56 17 $12,0 M. 16 2. 2.53 L. 16. 18 16.10 Red Property them Total Tai 43 2.400 16 203.105 16 2011 14. 203.700 . 30.SEL 22.01 22.12 1. PL 2. 18.00 2. Short Caps ADI Thes Arbe GR Total errent Notre Long term LID 6.14 62.300 9.79 4.00 3.62 4543 $ 9.71 122,00 BIG LOS Deler Minity Other long-term TORT Grant Total her Ch A en dam Actuer Total stockholder 200 122.12 . 120.92 7.30 30 2. 12.50 22 7. 13.00 7.30 203.60 200750 . Student Name: (print) Calculate ratios and circles highlight with color which ratio is best. Which company has the best Profit Margin, etc? Show the numerator and denominator in columns F&1 Target Wal-Mart Managerial Accounting Ratios for 2016 data: Ratio Categories Profitability In this column write the elements that are measured in the ratio. I have completed five as examples: Net income Revenue Prof Margin Profitability Retum on Total Assets Profitability Retum on Common Stockholders' Equity Profitability Earnings Per Share of Common Stock Net Income Prstened Dividend Number of the common shocking Analysing stock PE mato (Price-Earnings Current Ratio Liquidity (ability to pay current abilities) Profitability (stock ile) Book Value per share common stock TOSHE Number of shares of de Solvency Debt-to-Equity Ratio Turnover eiciency Inventory Turnover Cost of Revenue Average Inventory Turnover ciency AR Turnover (Accounts Receivable) Rev Average Receivables Turnover oficiency Total Asset Tumover 1. Write the ratio elements in the middle column of the worksheet: For example, Return on Sales is "Net Income / Revenue." "Neither company has issued Preferred Stock so there won't be any Preferred Dividends' "Cost of Revenue is another term for Cost of Goods Sold "Revenue is another term for Net Sales 2. Calculate the Financial Ratios for Target and Wal-Mart for Fiscal Year 2016 and enter data and ratios onto your worksheet. Round your answers to two decimal places 3. On the worksheet circle or highlight which ratio is the best when compared between the two corporations, Use the following data in addition to the financial statements: Target market price of $72.23 and Wal-Mart market price of $69,12 Target number of outstanding common shares is 561.7 in millions Wal-Mart number of outstanding common shares is 3073.19 in millions 4. Which stock would you buy? Write three complete paragraphs, addressing the strengths and weaknesses of each company and your reasoning for purchasing Target or Wal-Mart stock. Please read instruction page for additional information. Target Corp TGT Income Statement Balance Sheet Cash Flow Statement Type Annual helyear ende Dua Type As of Reported Period Data Scroll Show portato Ascending View 5 Years Revenue Cost of revenue Gross profit Operating expenses Sales, General and adm. Other operating expens... Total operating expens... Operating income 2011-01 73,301 51,035 22,216 16,095 14,914 1,981 16,095 5.371 2014-01 72.596 51,160 21,436 17.207 2015-01 72,618 51.278 21,340 16,005 14,676 2129 16,aos 4,535 2016-01 73.785 51.997 21,780 16,870 14,665 2,213 16,878 4,910 15.375 1,832 17,207 4,229 762 1.126 Interest Expense Other income (expense) Income before income 4,609 3.103 (882) 3,653 13 4,923 Provision for income t.. Net income from contin... 1,610 2,999 1.132 1,971 1,204 2.449 1,602 3.321 Nat income from discon Net Income 2. 1.971 (4,005) (1,636) 3,363 Target Corp TGT Income Sweet Base Sheet Current Ches 1413 Totalcash Rece 1. 744 ET Delerde BY 4.14 Total current 316 11.873 32 21,7 Pry Fotoren 20 . 22. 7. 2002 42 C) 20.05 Andere Property and 2. METE SO 34 . 4,16 4,16 31.03 14.00 2 2014 Eele 28. Start LIO 1 9 2,790 2.05 272 Ow Total hancuran unter der 7 LIN 1242 37.594 . 2. Personer Der er Tuta correntes SH US 5 LE 1. 17.578 11.40 IETE 22.07 1ST Como os A 32 16.231 59 40 3.925 Tutte 376 14.550 8.16 1 CL Wal-Mart Stores Inc WMT Add to Portfolio Get e-mail Alerts Print This Page POF Report Data Question Quote Chart Stock Analysis Performance Key Racios Financials Valuation Insiders Ownership Filings Bonds Income Statement Balance Sheet Cash Flow Period 5 Years Data Scroll View Show Report Dates Ascending Rounding Export 2016-01 Statement Type Duta Type Annual As of Reported Pemands USD Men et par the Revenue Cost of revenue Gross profe Operating expenses Sales, General and adm.. Total operating expens... Operating income 2012-01 446,950 335,127 111,823 55,265 85,265 85,265 26,550 2013-01 469,162 352,488 116,674 88,873 38,873 88,873 27,000 2014-01 476,294 358,069 110,225 91.153 91,353 91,353 26,872 2015.01 485,651 365,056 120,565 93,418 93,418 93,418 27,147 482,130 360,984 121.145 97,041 97,041 97,041 24,105 2,461 Interest Expense Other income (expense) Income before income t... 2.322 162 24,99 2.251 187 25.737 2,335 119 24,656 2.540 81 21,638 24,799 8,105 Provision for income Minority interest Omer income Net Income from contin... 2,901 757 7,944 688 688 16.454 673 673 16,551 757 7.985 736 736 16,814 6,556 386 386 17,756 15,000 Net income from discon... Other Net Income (67) (688) 15,699 (757) 16,999 (673) 16,022 285 (736) 16,363 (386) 14,094 Wal-Mart Stores Inc WMT Dean State Show Chow ! the Afa ce AM 1 SY 20,105 10 1.13 54.575 4.590 Cash Chand Totalca News the 2.05 . . LO 7. s. Ordre Total carrers Ron 58.8 6,13 14,50 10.230 15, 1.56 1166 21. 5.56 17 $12,0 M. 16 2. 2.53 L. 16. 18 16.10 Red Property them Total Tai 43 2.400 16 203.105 16 2011 14. 203.700 . 30.SEL 22.01 22.12 1. PL 2. 18.00 2. Short Caps ADI Thes Arbe GR Total errent Notre Long term LID 6.14 62.300 9.79 4.00 3.62 4543 $ 9.71 122,00 BIG LOS Deler Minity Other long-term TORT Grant Total her Ch A en dam Actuer Total stockholder 200 122.12 . 120.92 7.30 30 2. 12.50 22 7. 13.00 7.30 203.60 200750
