Answered step by step
Verified Expert Solution
Link Copied!

Question

1 Approved Answer

Student Response Number)* Student #1 3 Student #2 Student #3 21 Student #4 13 Student #5 3.5 Student #6 Student #7 Student #8 4 Student
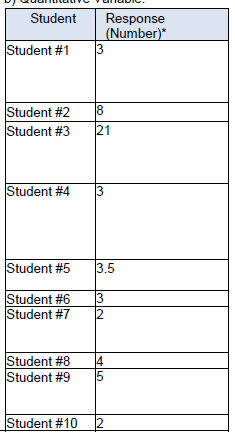
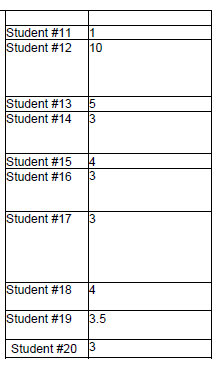
image text in transcribedimage text in transcribedimage text in transcribed
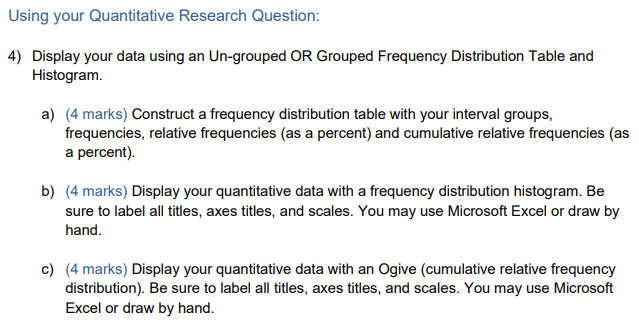
Student Response Number)* Student #1 3 Student #2 Student #3 21 Student #4 13 Student #5 3.5 Student #6 Student #7 Student #8 4 Student #9 5 Student #10 12\fUsing your Quantitative Research Question: 4) Display your data using an Un-grouped OR Grouped Frequency Distribution Table and Histogram. a) (4 marks) Construct a frequency distribution table with your interval groups, frequencies, relative frequencies (as a percent) and cumulative relative frequencies (as a percent). b) (4 marks) Display your quantitative data with a frequency distribution histogram. Be sure to label all titles, axes titles, and scales. You may use Microsoft Excel or draw by hand. c) (4 marks) Display your quantitative data with an Ogive (cumulative relative frequency distribution). Be sure to label all titles, axes titles, and scales. You may use Microsoft Excel or draw by hand
Step by Step Solution

There are 3 Steps involved in it

Step: 1

blur-text-image

Get Instant Access to Expert-Tailored Solutions

See step-by-step solutions with expert insights and AI powered tools for academic success

Step: 2

blur-text-image

Step: 3

blur-text-image

Ace Your Homework with AI

Get the answers you need in no time with our AI-driven, step-by-step assistance

Get Started

Recommended Textbook for

Finite Math And Applied Calculus

Authors: Stefan Waner, Steven Costenoble

2nd Edition

0534366309, 9780534366308

More Books

Students also viewed these Mathematics questions