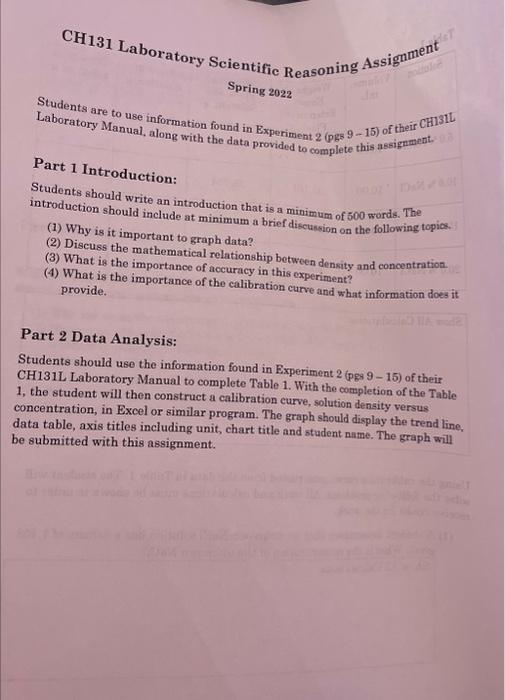
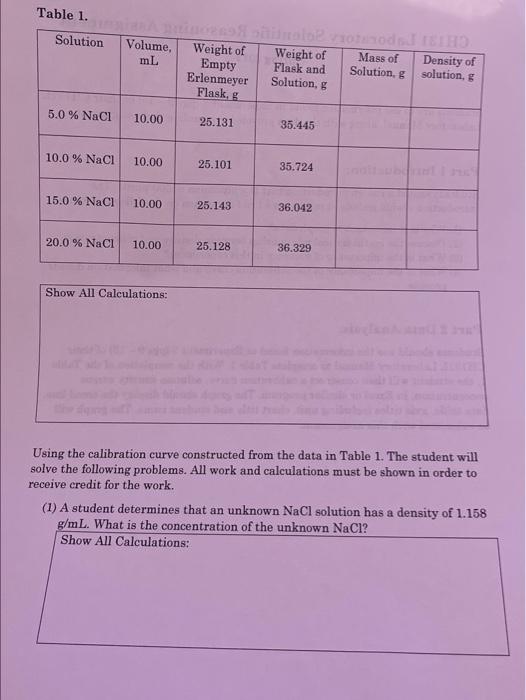
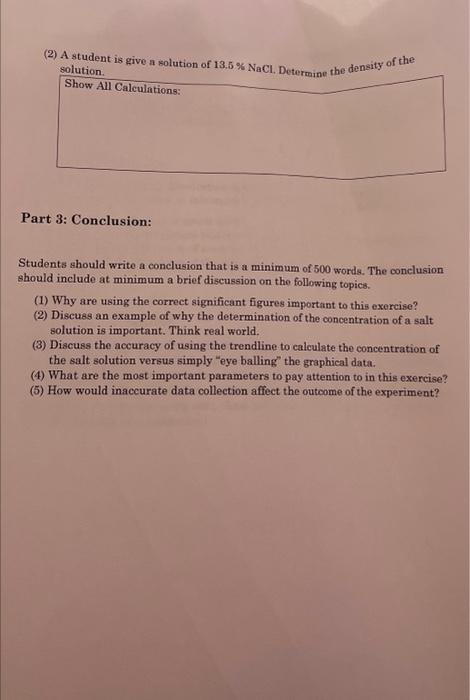
Students are to use information found in Experiment 2 (pgs 9-15) of their CHI31L Laboratory Manual, along with the data provided to complete this assignment. Part 1 Introduction: Students should write an introduction that is a minimum of 500 words. The introduction should include at minimum a brief discusion on the following topios. (1) Why is it important to graph data? (2) Discuss the mathematical relationship between density and concentration. (3) What is the importance of accuracy in this experiment? (4) What is the importance of the calibration curve and what information does it provide. Part 2 Data Analysis: Students should use the information found in Experiment 2 (pgs 9 - 15) of their CH131L Laboratory Manual to complete Table 1. With the completion of the Table 1, the student will then construct a calibration curve, solution density versus concentration, in Excel or similar program. The graph should display the trend line, data table, axis titles including unit, chart title and student name. The graph will be submitted with this assignment. Table 1. Using the calibration curve constructed from the data in Table 1. The student will solve the following problems. All work and calculations must be shown in order to receive credit for the work. (1) A student determines that an unknown NaCl solution has a density of 1.158 g/mL. What is the concantration of the unlennum N omo (2) A student is give a solution of 13.5%NaCl. Determine the density of the solution. Show All Calculations: Part 3: Conclusion: Students should write a conclusion that is a minimum of 500 words. The conclusion should include at minimum a brief discussion on the following topics. (1) Why are using the correct significant figures important to this exercise? (2) Discuss an example of why the determination of the concentration of a salt solution is important. Think real world. (3) Discuss the accuracy of using the trendline to calculate the concentration of the salt solution versus simply "eye balling" the graphical data. (4) What are the most important parameters to pay attention to in this exercise? (5) How would inaccurate data collection affect the outcome of the experiment


