Answered step by step
Verified Expert Solution
Link Copied!

Question

1 Approved Answer

# Students should implement the following four functions in Solution_Q1.R: # generateData: takes as input the test results number, probability of positive results, and name
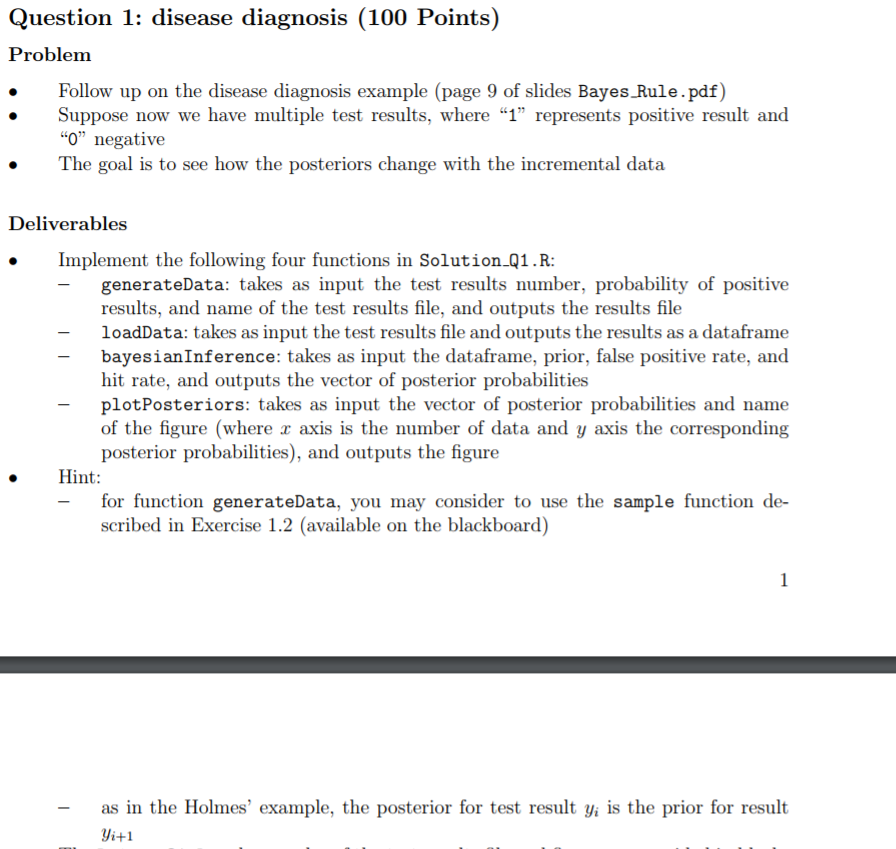
image text in transcribed

# Students should implement the following four functions in Solution_Q1.R: # generateData: takes as input the test results number, probability of positive results, and name of the test results file, and outputs the results file # loadData: takes as input the test results file and outputs the results as a dataframe # bayesianInference: takes as input the dataframe, prior, false positive rate, and hit rate, and outputs the vector of posterior probabilities # plotProsterior: takes as input the vector of posterior probabilities and name of the figure (where x axis is the number of data and y axis the corresponding posterior probabilities), and outputs the figure

source("Solution_Q1.R")

# Test results file testResultsFile = "testResults.csv" # Test results number testRusultsNum = 100 # Positive test results probability PosTestResultsProb = 0.9 # Posterior probabilitites figure posteriorsFig = "posteriorsFig"

# Probabilities prior = 0.001 # Prior probabilities fpr = 0.05 # False positive rate hr = 0.99 # Hit rate

# Takes as input the test results number, probability of positive results, and name of the test results file, and outputs the results file generateData

# Takes as input the test results file and outputs the results as a dataframe testResults = loadData(testResultsFile)

# Takes as input the dataframe, prior, false positive rate, and hit rate, and outputs the vector of posterior probabilities posteriors = bayesianInference(testResults, prior, fpr, hr)

# Takes as input the vector of posterior probabilities and name of the figure (where x axis is the number of data and y axis the corresponding posterior probabilities), and outputs the figure plotPosteriors(posteriors, posteriorsFig)

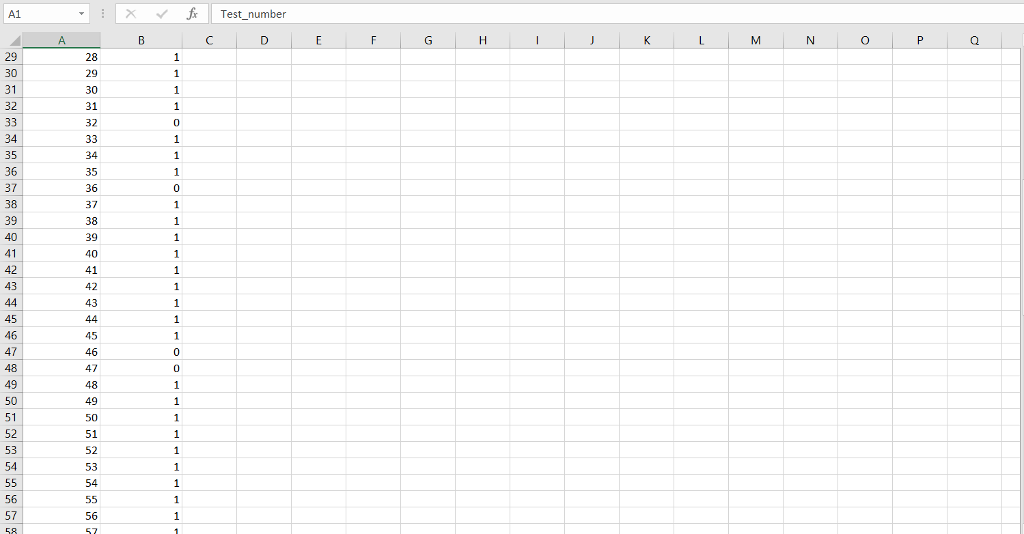
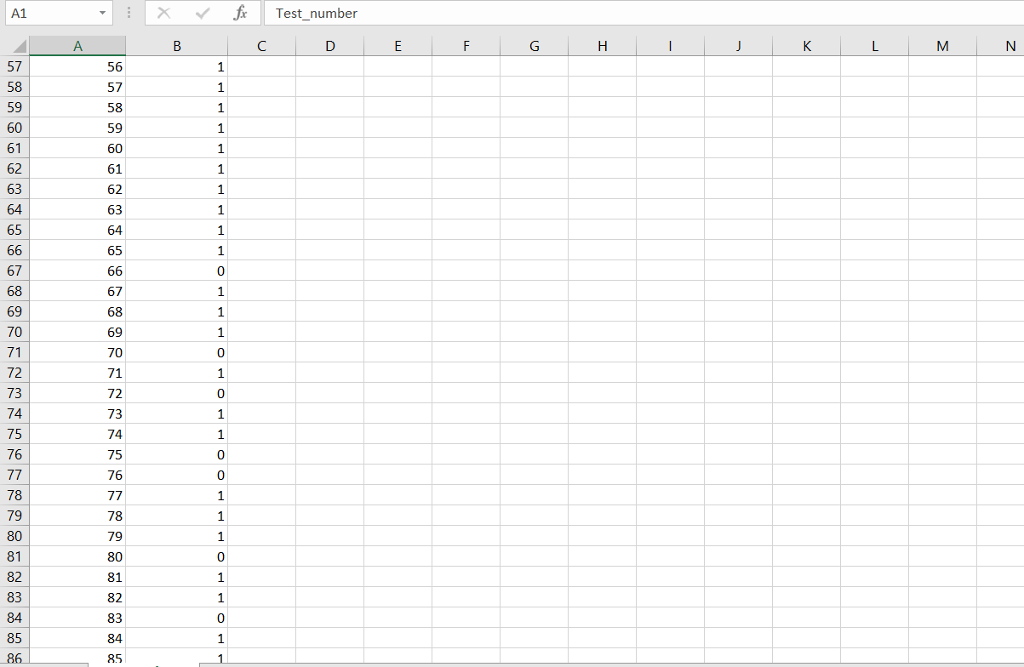
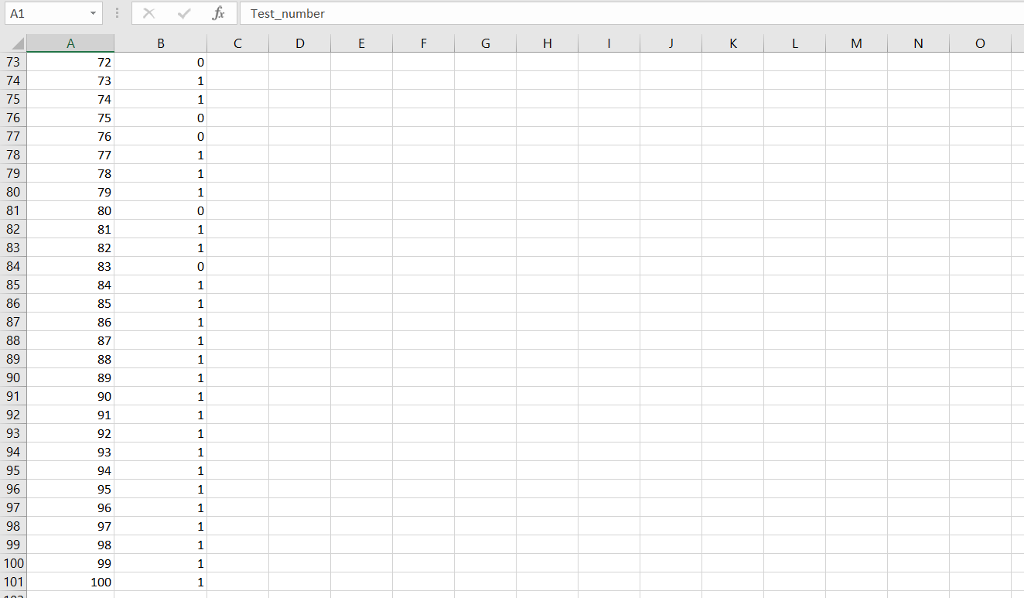
Input File:
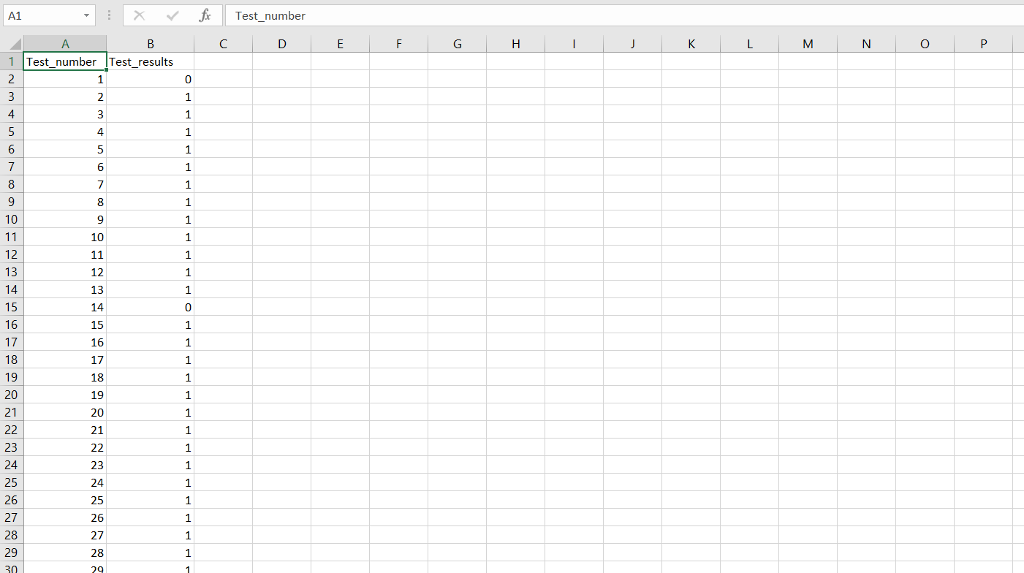
image text in transcribedimage text in transcribedimage text in transcribedimage text in transcribed

Question 1: disease diagnosis (100 Points) Problem Follow up on the disease diagnosis example (page 9 of slides Bayes Rule.pdf) Suppose now we have multiple test results, where "1 " represents positive result and O negative The goal is to see how the posteriors change with the incremental data Deliverables Implement the following four functions in Solution Q1.R: generateData: takes as input the test results number, probability of positive results, and name of the test results file, and outputs the results file loadData: takes as input the test results file and outputs the results as a dataframe bayesianInference takes as input the dataframe, priorfalse positive rate, and hit rate, and outputs the vector of posterior probabilities plotPosteriors: takes as input the vector of posterior probabilities and name of the figure (where Y axis is the number of data and Y axis the corresponding posterior probabilities), and outputs the figure Hint: for function generateData, you may consider to use the sample function de- scribed in Exercise 1.2 (available on the blackboard) as in the Holmes' example, the posterior for test result Y, is the prior for result Yi+1 Question 1: disease diagnosis (100 Points) Problem Follow up on the disease diagnosis example (page 9 of slides Bayes Rule.pdf) Suppose now we have multiple test results, where "1 " represents positive result and O negative The goal is to see how the posteriors change with the incremental data Deliverables Implement the following four functions in Solution Q1.R: generateData: takes as input the test results number, probability of positive results, and name of the test results file, and outputs the results file loadData: takes as input the test results file and outputs the results as a dataframe bayesianInference takes as input the dataframe, priorfalse positive rate, and hit rate, and outputs the vector of posterior probabilities plotPosteriors: takes as input the vector of posterior probabilities and name of the figure (where Y axis is the number of data and Y axis the corresponding posterior probabilities), and outputs the figure Hint: for function generateData, you may consider to use the sample function de- scribed in Exercise 1.2 (available on the blackboard) as in the Holmes' example, the posterior for test result Y, is the prior for result Yi+1

Step by Step Solution

There are 3 Steps involved in it

Step: 1

blur-text-image

Get Instant Access to Expert-Tailored Solutions

See step-by-step solutions with expert insights and AI powered tools for academic success

Step: 2

blur-text-image

Step: 3

blur-text-image

Ace Your Homework with AI

Get the answers you need in no time with our AI-driven, step-by-step assistance

Get Started

Recommended Textbook for

Database Driven Web Sites

Authors: Mike Morrison, Joline Morrison

1st Edition

061901556X, 978-0619015565

More Books

Students also viewed these Databases questions

Question

1. What are the peculiarities of viruses ?

Answered: 1 week ago

Question

Describe the menstrual cycle in a woman.

Answered: 1 week ago