Answered step by step
Verified Expert Solution
Question
1 Approved Answer
Students will also obtain financial information on the banks that they have been assigned relative to the banks Financial Standing including Profitability , capital adequacy
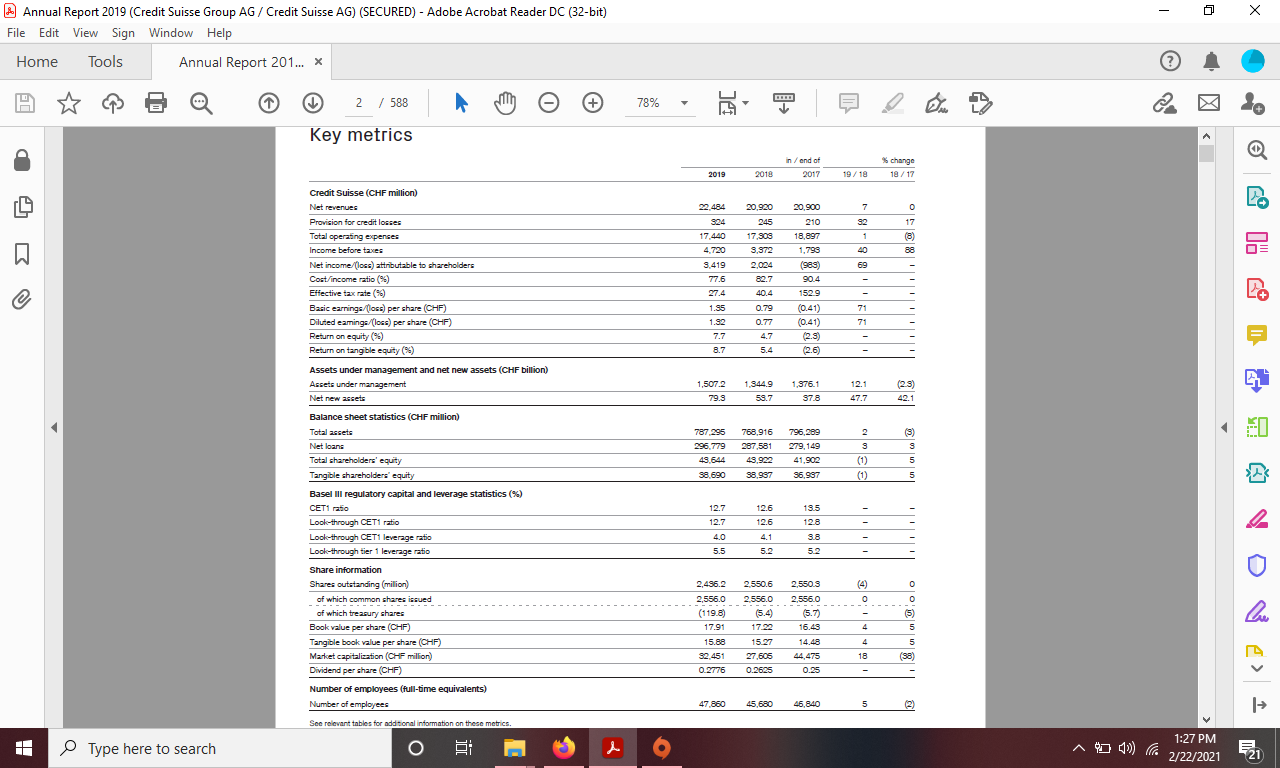
 Students will also obtain financial information on the banks that they have been assigned relative to the banks Financial Standing including Profitability, capital adequacy, liquidity, overseas representation and existing and former exposure if any to International Crises. They will provide written calculations of the Banks ROA, ROE,ROI, EM and Leverage ratios for a Two/three year latest trend to determine its strength in financial markets.
I need the answer relating to CREDIT SUISSE BANK in Switzerland.
The Italics need to be answered.
Thank you
- Annual Report 2019 (Credit Suisse Group AG / Credit Suisse AG) (SECURED) - Adobe Acrobat Reader DC (32-bit) File Edit View Sign Window Help Home Tools Annual Report 201... x 1 2 / 588 + 78% 1 Key metrics change in / end of 2017 2019 2018 18/17 7 0 17 S2 (8) 22.484 S24 17.440 4.720 9.419 77.6 20.920 245 17,308 3,372 2.024 827 40 Credit Suisse (CHF million) Net revenues Provision for credit losses Total operating expenses Income before taxes Net income/loss) attributable to shareholders Cost/income ratio (9) Effective tax rate (96) Basic earnings/(los) per share (CHF) Diluted eamings/(loss) per share (CHF) Return on equity (%) Return on tangible equity (95) 20,900 210 18.897 1.795 (ses) 90.4 88 69 27.4 40.4 1529 - 1.95 0.79 71 71 1.32 7.7 0.77 4.7 5.4 (0.41) (0.41) (2.8) (2.6) = 8.7 - 12.1 1,5072 79.3 1.344.9 59.7 1.376.1 37.8 (2.5) 42.1 47.7 787 295 296.779 49 644 98.690 768,916 287,581 43.922 796,289 279,149 41.902 56,997 3 (1) (1) (S) S 5 5 98.987 12.6 Assets under management and net new assets (CHF billion) Assets under management Net new assets Balance sheet statistics (CHF million) Total assets Net loans Total shareholders' equity Tangible shareholders' equity Basel III regulatory capital and leverage statistics (%) CET1 ratio wa Look-through CET1 ratio Look-through CET1 leverage ratio Look-through tier 1 leverage ratio Share information Shares outstanding (milion) of which common shares issued of which treasury shares Book value per share (CHF) Tangible book value per share (CHF) Market capitalization (CHF million) Dividend per share (CHF) 12.7 12.7 13.5 128 12.6 2 4.1 5.2 3.8 5.2 5.5 - 2,550,5 (4) 2.550.6 2.556.0 0 0 2,496.2 2,556.0 (119.8) 17.91 ( 2,556.0 (5.7) ) 16.43 (5) 5 17.22 4 15.88 14.48 4 5 15.27 27 605 0.2625 18 32.451 0.2776 (98 44,475 0.25 Number of employees (full-time equivalents) Number of employees 47.860 45.680 46,840 5 (2) | | + See relevant tables for additional information on these metrics. 1:27 PM j 1 Type here to search PO E A 4 )) 2/22/2021 721 - Annual Report 2019 (Credit Suisse Group AG / Credit Suisse AG) (SECURED) - Adobe Acrobat Reader DC (32-bit) File Edit View Sign Window Help Home Tools Annual Report 201... x 1 2 / 588 + 78% 1 Key metrics change in / end of 2017 2019 2018 18/17 7 0 17 S2 (8) 22.484 S24 17.440 4.720 9.419 77.6 20.920 245 17,308 3,372 2.024 827 40 Credit Suisse (CHF million) Net revenues Provision for credit losses Total operating expenses Income before taxes Net income/loss) attributable to shareholders Cost/income ratio (9) Effective tax rate (96) Basic earnings/(los) per share (CHF) Diluted eamings/(loss) per share (CHF) Return on equity (%) Return on tangible equity (95) 20,900 210 18.897 1.795 (ses) 90.4 88 69 27.4 40.4 1529 - 1.95 0.79 71 71 1.32 7.7 0.77 4.7 5.4 (0.41) (0.41) (2.8) (2.6) = 8.7 - 12.1 1,5072 79.3 1.344.9 59.7 1.376.1 37.8 (2.5) 42.1 47.7 787 295 296.779 49 644 98.690 768,916 287,581 43.922 796,289 279,149 41.902 56,997 3 (1) (1) (S) S 5 5 98.987 12.6 Assets under management and net new assets (CHF billion) Assets under management Net new assets Balance sheet statistics (CHF million) Total assets Net loans Total shareholders' equity Tangible shareholders' equity Basel III regulatory capital and leverage statistics (%) CET1 ratio wa Look-through CET1 ratio Look-through CET1 leverage ratio Look-through tier 1 leverage ratio Share information Shares outstanding (milion) of which common shares issued of which treasury shares Book value per share (CHF) Tangible book value per share (CHF) Market capitalization (CHF million) Dividend per share (CHF) 12.7 12.7 13.5 128 12.6 2 4.1 5.2 3.8 5.2 5.5 - 2,550,5 (4) 2.550.6 2.556.0 0 0 2,496.2 2,556.0 (119.8) 17.91 ( 2,556.0 (5.7) ) 16.43 (5) 5 17.22 4 15.88 14.48 4 5 15.27 27 605 0.2625 18 32.451 0.2776 (98 44,475 0.25 Number of employees (full-time equivalents) Number of employees 47.860 45.680 46,840 5 (2) | | + See relevant tables for additional information on these metrics. 1:27 PM j 1 Type here to search PO E A 4 )) 2/22/2021 721Step by Step Solution
There are 3 Steps involved in it
Step: 1

Get Instant Access to Expert-Tailored Solutions
See step-by-step solutions with expert insights and AI powered tools for academic success
Step: 2

Step: 3

Ace Your Homework with AI
Get the answers you need in no time with our AI-driven, step-by-step assistance
Get Started


