

Question
Students will construct a set of forecasted financial statements and calculate a set of financial ratios for a start-up business. Note: Please read the documents
Students will construct a set of forecasted financial statements and calculate a set of financial ratios for a start-up business.
Note: Please read the documents related to forecasting financial statements under Documents & Resources in Week 4. Additionally, search online for information regarding forecasting financial statements. [Dont skip this step! It will provide background context and insight into what youll be doing for this assignment.] You will notice that there are many methods to use to forecast financials. Some are quantitative while others are qualitative. Often times, a mix of the two are used. There is no one exact way to perform forecasting.
For the purpose of this assignment, you will be relying on the directions given under Forecasting Assumptions to complete the Excel workbook.
Case Overview
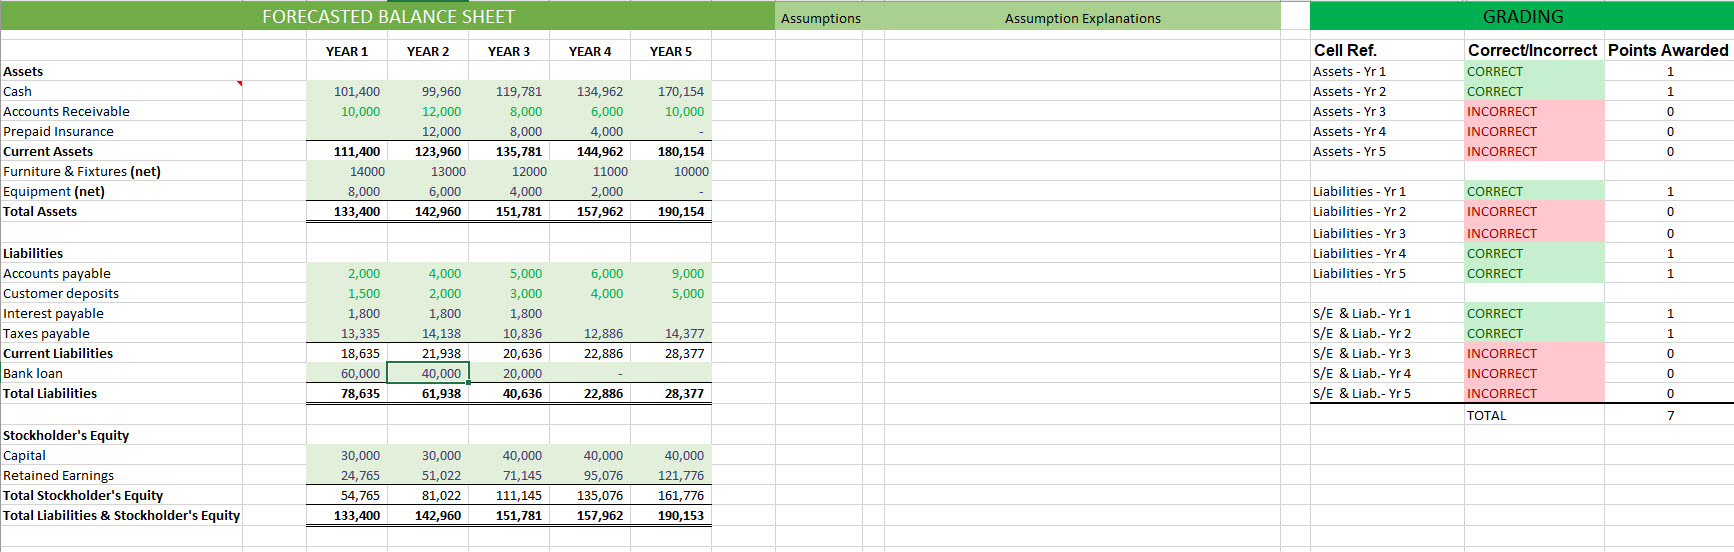
Janelle Higgins has decided to start her own event planning business (JH Events) in the upcoming year. She believes that she has an innovative business model and is seeking a business loan. Therefore, Janelle is in the process of putting together a business plan. As part of her business plan, Janelle must include forecasted financial statements for the first 5 years. The forecasted financial statements to be included are: Income Statement, Balance Sheet, and Statement of Cash Flows. Janelle must also include a set of calculated ratios along with an overall assessment on the projected health of the company.
Forecasting Assumptions
- First year sales are projected to be $150,000 and grow 3% for the next two years and 5% in year 4 and 5.
- Cost of sales are projected to be 45% of revenue in the first year and is expected to grow at the same rate as sales.
- Advertising expenses are projected to be 4% of each years projected revenue.
- Janelle will need to rent equipment for the events she puts on. She has an agreement with a rental company for a flat rate of $500 per month and is sufficient to cover all of her estimated events. Starting in Year 3, she expects to be able to handle more events and the rental rate will increase to $750 per month.
- Janelle plans to start off by hiring 2 people to work the events with her. Each person will be paid $100 per event and is expected to work 4 events per month. After Year 3, Janelle plans to hire 2 additional people. (At this point, each person will be paid $100 per event and is expected to work 3 events per month).
- Office rent is estimated to be a flat rate of $1,200 per month.
- Utilities for the rented office space are estimated to be $300 per month.
- The office space Janelle plans to rent is unfurnished. She plans to purchase $15,000 worth of furniture and fixtures at the beginning of Year 1. The furniture and fixtures will have a useful life of 15 years. Janelle will also need to buy some computers and other office equipment that she will purchase for $10,000 also at the beginning of Year 1. The office equipment will have a useful life of 5 years. Both the furniture and fixtures as well as the equipment will be depreciated on a straight-line basis (Assume zero salvage value for calculations). HINT: Fixed Assets Accumulated Depreciation = Net Fixed Assets
- Janelle is asking for a 3-year bank loan for $60,000 to be funded on Day1 of Year 1. The estimated interest on the loan is 3% (assume simple interest). She will pay the loan back in $20,000 installments starting in Year 2. Interest is due at the end of each year and paid in January of the following year. (Assume interest is paid on the principal balance still outstanding at year-end).
- The tax rate for JH Events is 35%. Taxes for the year just ended are payed in the first quarter of the following year.
- Janelle will invest $30,000 of her own money and from family and friends, before the beginning of the year, to start the business. This $30,000 investment of capital is also the beginning bank balance of Year 1.
- Schedule of expected year-end balances of selected accounts:
|
| Year 1 | Year 2 | Year 3 | Year 4 | Year 5 |
| Accounts Receivable | 10,000 | 12,000 | 8,000 | 6,000 | 10,000 |
| Accounts Payable | 2,000 | 4,000 | 5,000 | 6,000 | 9,000 |
| Customer Deposits | 1,500 | 2,000 | 3,000 | 4,000 | 5,000 |
- At the end of Year 2, Janelle will purchase an insurance policy to help cover the business. The policy has a term of 3 years and coverage starts at the beginning of Year 3. The policy costs $12,000.
- During Year 3, Janelle plans to personally invest $10,000 of additional capital into the business.
Chart of Accounts
All accounts listed here should be included in your financial statements.
- Cash
- Accounts Receivable
- Prepaid Insurance
- Furnitures & Fixtures
- Equipment
- Accounts Payable
- Customer Deposits
- Interest Payable
- Taxes Payable
- Bank Loan
- Capital
- Retained Earnings
- Revenue
- Cost of Sales
- Advertising
- Equipment Rental
- Wages
- Office Rent
- Utilities
- Insurance Expense
- Depreciation
- Interest Expense
- Income Taxes
Additional Instructions & Guidance
- You must use the given Excel template attached to this assignment.
- The three financial statements are interconnected. Where applicable, reference the appropriate cells from other tabs. Also, use formulas within the cells where applicable. (Instructors may deduct points for not using cell references and formulas.) There are some formulas already included in various cells do not alter these formulas.
- Some cells have additional notes (cells marked with a red triangle in the upper right-hand corner; hover over the triangle to see the note).
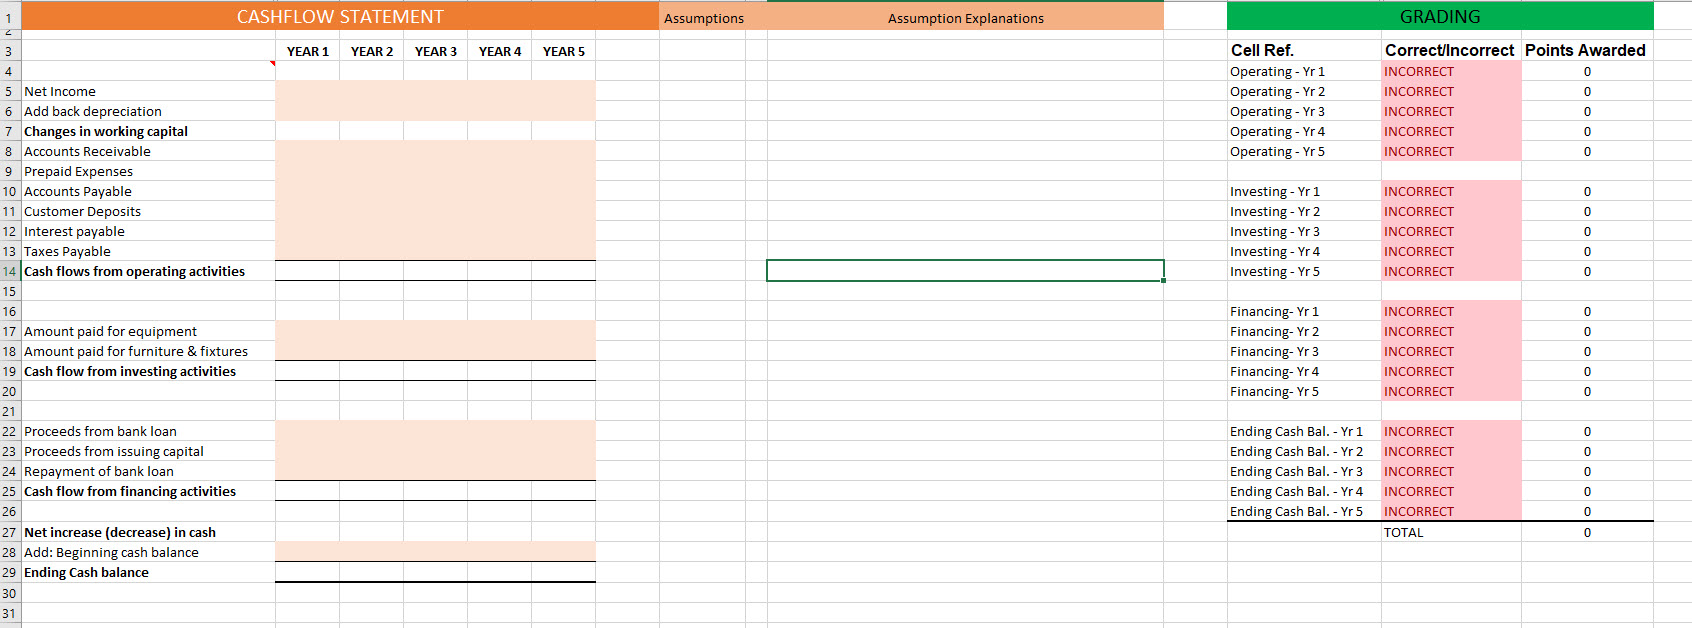
- Review Chapter 4 for helpful information in completing the Cash Flow Statement.
- The shaded areas are for data input. (NOTE: You will need to enter formulas to calculate subtotals on the Cash Flow Statement tab for each major category)
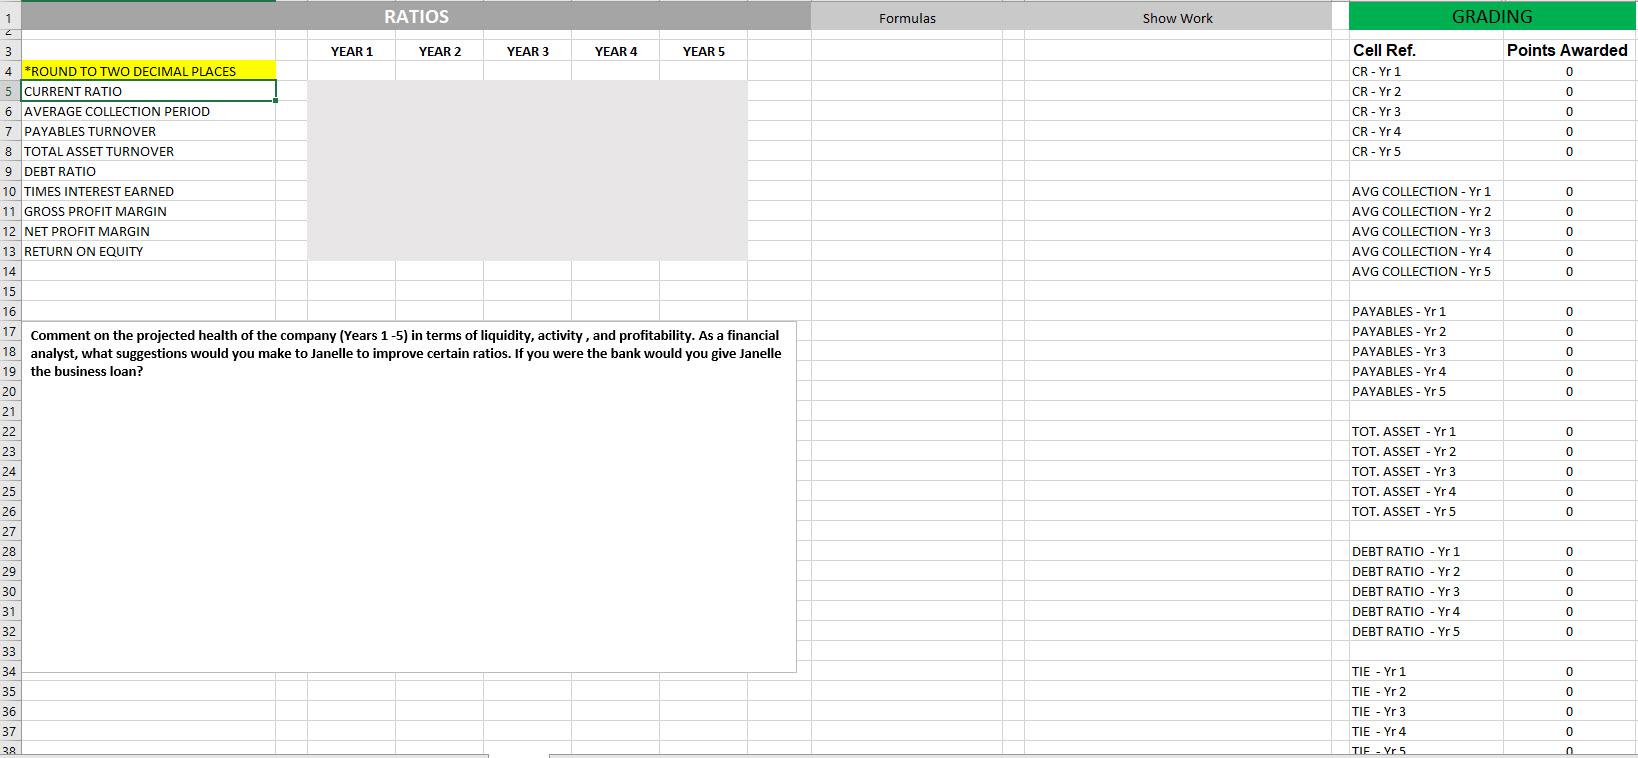
- On each tab there is an area to keep track of the various assumptions. The column labeled Assumptions is to make note of any numbers, percentages, etc. relevant to that line item. The column labeled Assumption Explanations is to help keep track of the Forecasting Assumptions from above. (You can copy and paste the assumptions onto the relevant line item). On the Ratios tab there is an area to layout the formulas and show your work.
- There is a grading area on each tab that is being calculated as you input information. Please use this area to see where any mistakes are being made.
- You must upload your file to Blackboard under Week 5 Assignments (Include your name as part of the file name). Go to the Assignment, scroll down to Attach Local File and click Browse to select YOUR file, then hit SUBMIT.
***PLEASE PROVIDE FORMULAS AS WELL**** Thank you!
FORECASTED BALANCE SHEET Assumptions Assumption Explanations GRADING YEAR 1 YEAR 2 YEAR 3 YEAR 4 YEAR 5 101,400 170,154 Assets Cash Accounts Receivable Prepaid Insurance Current Assets Furniture & Fixtures (net) Equipment (net) Total Assets 10,000 10,000 Cell Ref. Assets - Yr 1 Assets - Yr 2 Assets - Yr 3 Assets - Yr 4 Assets - Yr 5 99,960 12,000 12,000 123,960 13000 6,000 142,960 Correct/incorrect Points Awarded CORRECT 1 CORRECT 1 INCORRECT 0 INCORRECT 0 INCORRECT 0 119,781 8,000 8,000 135,781 12000 4,000 151,781 134,962 6,000 4,000 144,962 11000 2,000 157,962 111,400 14000 8,000 133,400 180,154 10000 1 CORRECT INCORRECT 190,154 0 Liabilities - Yr 1 Liabilities - Yr 2 Liabilities - Yr 3 Liabilities - Yr 4 Liabilities - Yr 5 INCORRECT 0 1 CORRECT CORRECT 1 6,000 4,000 9,000 5,000 CORRECT 1 Liabilities Accounts payable Customer deposits Interest payable Taxes payable Current Liabilities Bank loan Total Liabilities 2,000 1,500 1,800 13,335 18,635 60,000 78,635 4,000 2,000 1,800 14,138 21,938 40,000 61,938 5,000 3,000 1,800 10,836 20,636 20,000 40,636 CORRECT 1 12,886 22,886 14,377 28,377 S/E & Liab.-Yr 1 S/E & Liab.-Yr 2 S/E & Liab.- Yr 3 S/E & Liab-Yr 4 S/E & Liab.-Yr 5 0 INCORRECT INCORRECT 0 0 22,886 28,377 INCORRECT TOTAL 7 30,000 Stockholder's Equity Capital Retained Earnings Total Stockholder's Equity Total Liabilities & Stockholder's Equity 51,022 30,000 24,765 54,765 133,400 40,000 71,145 111,145 151,781 40,000 95,076 135,076 157,962 40,000 121,776 161,776 190,153 81,022 142,960 CASHFLOW STATEMENT Assumptions Assumption Explanations GRADING 3 YEAR 1 YEAR 2 YEAR 3 YEAR 4 YEAR 5 0 Cell Ref. Operating - Yr 1 Operating - Yr 2 Operating - Yr 3 Operating - Yr 4 Operating - Yr 5 Correct/Incorrect Points Awarded INCORRECT INCORRECT 0 INCORRECT INCORRECT 0 INCORRECT 0 0 0 Investing - Yr 1 Investing - Yr 2 Investing - Yr 3 Investing - Yr 4 Investing - Yr 5 INCORRECT INCORRECT INCORRECT INCORRECT INCORRECT 0 0 0 4 5 Net Income 6 Add back depreciation 7 Changes in working capital 8 Accounts Receivable 9 Prepaid Expenses 10 Accounts Payable 11 Customer Deposits 12 Interest payable 13 Taxes Payable 14 Cash flows from operating activities 15 16 17 Amount paid for equipment 18 Amount paid for furniture & fixtures 19 Cash flow from investing activities 20 21 22 Proceeds from bank loan 23 Proceeds from issuing capital 24 Repayment of bank loan 25 Cash flow from financing activities 26 27 Net increase (decrease) in cash 28 Add: Beginning cash balance 29 Ending Cash balance 30 31 Financing-Yr 1 Financing-Yr 2 Financing-Yr 3 Financing-Yr 4 Financing-Yr 5 INCORRECT INCORRECT INCORRECT INCORRECT INCORRECT 0 0 Ending Cash Bal. - Yr 1 Ending Cash Bal. - Yr 2 Ending Cash Bal. - Yr 3 Ending Cash Bal. - Yr 4 Ending Cash Bal. - Yr 5 0 INCORRECT INCORRECT INCORRECT INCORRECT INCORRECT TOTAL 0 0 1 RATIOS Formulas Show Work GRADING Points Awarded 0 0 Cell Ref. CR-Yr 1 CR-Yr 2 CR-Yr 3 CR - Yr 4 CR-Yr 5 0 0 0 AVG COLLECTION - Yr 1 AVG COLLECTION - Yr 2 AVG COLLECTION - Yr 3 AVG COLLECTION - Yr 4 AVG COLLECTION - Yr 5 PAYABLES - Yr 1 PAYABLES - Yr 2 PAYABLES - Yr 3 PAYABLES - Yr 4 PAYABLES - Yr 5 3 YEAR 1 YEAR 2 YEAR 3 YEAR 4 YEAR 5 4 *ROUND TO TWO DECIMAL PLACES 5 CURRENT RATIO 6 AVERAGE COLLECTION PERIOD 7 PAYABLES TURNOVER 8 TOTAL ASSET TURNOVER 9 DEBT RATIO 10 TIMES INTEREST EARNED 11 GROSS PROFIT MARGIN 12 NET PROFIT MARGIN 13 RETURN ON EQUITY 14 15 16 17 Comment on the projected health of the company (Years 1-5) in terms of liquidity, activity, and profitability. As a financial 18 analyst, what suggestions would you make to Janelle to improve certain ratios. If you were the bank would you give Janelle 19 the business loan? 20 21 22 23 24 25 26 27 28 29 30 31 32 33 34 35 36 37 38 TOT. ASSET - Yr 1 TOT. ASSET - Yr 2 TOT. ASSET - Yr 3 TOT. ASSET - Yr 4 TOT. ASSET - Yr 5 O O O O O DEBT RATIO - Yr 1 DEBT RATIO - Yr 2 DEBT RATIO - Yr 3 DEBT RATIO - Yr 4 DEBT RATIO - Yr 5 O O O O O TIE - Yr 1 TIE - Yr 2 TIE - Yr 3 TIE - Yr 4 TIE-Yr 5Step by Step Solution
There are 3 Steps involved in it
Step: 1

Get Instant Access to Expert-Tailored Solutions
See step-by-step solutions with expert insights and AI powered tools for academic success
Step: 2

Step: 3
Ace Your Homework with AI
Get the answers you need in no time with our AI-driven, step-by-step assistance
Get Started
Intermediate Accounting principles and analysis
Authors: Terry d. Warfield, jerry j. weygandt, Donald e. kieso
2nd Edition
471737933, 978-0471737933