Answered step by step
Verified Expert Solution
Link Copied!

Question

1 Approved Answer

Study the LEGO Group Financial Highlights. How is Legos financial performance between 2006-2010? Income Statement: 2010 2007 Revenue O Expenses 7,798 (10,899) (8,659) (7,522) (6,556)

Study the LEGO Group Financial Highlights. How is Legos financial performance between 2006-2010? image text in transcribed
Income Statement: 2010 2007 Revenue O Expenses 7,798 (10,899) (8,659) (7,522) (6,556) (6,393) 1,405 16,014 11,661 9,526 8,027 2,0041,471 Operating profit before special items Special items Financial income and expenses Profit before income tax Net profit for the year Balance Sheet: 5,115 3,002 (142) (100) 96 (22) (80) (84) (15) (248) (35) (44) d 4,889 2,887 1,852 1,414 1,281 3,718 2,204 1,352 1,028 1,290 Total assets 10,972 7,788 6,496 6,009 6,907 5,473 3,291 2,066 1,6791,191 4,430 4,3305,716 Liabilities 5,499 4,497 Cash Flow Statement Cash flows from operating activities Investment in property, plant and equipment Investment in intangible assets Cash flows from financing activities3,477) (906) Total cash flows 3,744 2,712 1,954 1,0331,157 1,0771,042 123 216 (1,682)(467)597 592 1,925 (871) 558 Employees: Average number (full-time) Financial ratios (in %): 8,365 7,286 5,388 4,199 4,908 65.0 64.9 17.0 16.5 70.3 66.8 Gross margin Operating margin (ROS) Net profit margin Return on equity (ROE) Return on invested capital (ROIC D Return on invested capital (ROIC I) Equity ratio Equity ratio 31.1 24.9 22.0 18.1 232 18.9142 128 84.8 82.3 72.2 71.6147.1 63.6 67.4 17.2 33.2 161.2 139.5101.8 69.7 157.9138.0113.8 42.3 42.3 31.8 39.5 27.9 49.9 49.9 Income Statement: 2010 2007 Revenue O Expenses 7,798 (10,899) (8,659) (7,522) (6,556) (6,393) 1,405 16,014 11,661 9,526 8,027 2,0041,471 Operating profit before special items Special items Financial income and expenses Profit before income tax Net profit for the year Balance Sheet: 5,115 3,002 (142) (100) 96 (22) (80) (84) (15) (248) (35) (44) d 4,889 2,887 1,852 1,414 1,281 3,718 2,204 1,352 1,028 1,290 Total assets 10,972 7,788 6,496 6,009 6,907 5,473 3,291 2,066 1,6791,191 4,430 4,3305,716 Liabilities 5,499 4,497 Cash Flow Statement Cash flows from operating activities Investment in property, plant and equipment Investment in intangible assets Cash flows from financing activities3,477) (906) Total cash flows 3,744 2,712 1,954 1,0331,157 1,0771,042 123 216 (1,682)(467)597 592 1,925 (871) 558 Employees: Average number (full-time) Financial ratios (in %): 8,365 7,286 5,388 4,199 4,908 65.0 64.9 17.0 16.5 70.3 66.8 Gross margin Operating margin (ROS) Net profit margin Return on equity (ROE) Return on invested capital (ROIC D Return on invested capital (ROIC I) Equity ratio Equity ratio 31.1 24.9 22.0 18.1 232 18.9142 128 84.8 82.3 72.2 71.6147.1 63.6 67.4 17.2 33.2 161.2 139.5101.8 69.7 157.9138.0113.8 42.3 42.3 31.8 39.5 27.9 49.9 49.9

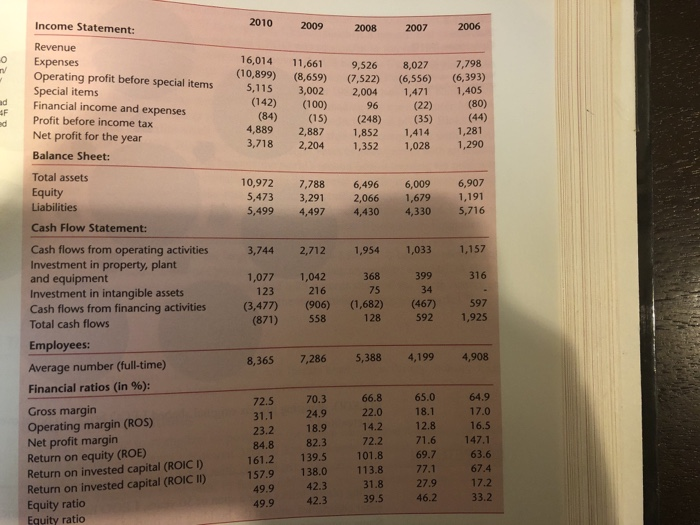
Step by Step Solution

There are 3 Steps involved in it

Step: 1

blur-text-image

Get Instant Access to Expert-Tailored Solutions

See step-by-step solutions with expert insights and AI powered tools for academic success

Step: 2

blur-text-image

Step: 3

blur-text-image

Ace Your Homework with AI

Get the answers you need in no time with our AI-driven, step-by-step assistance

Get Started

Recommended Textbook for

Take The Trade A Floor Trade

Authors: Tony Wilson

1st Edition

979-8218195458

More Books

Students also viewed these Finance questions