Answered step by step
Verified Expert Solution
Question
1 Approved Answer
Study Tools ons cess Tips cess Tips back The following graph shows the contingency graph for sellers of euro call options, with a premium of
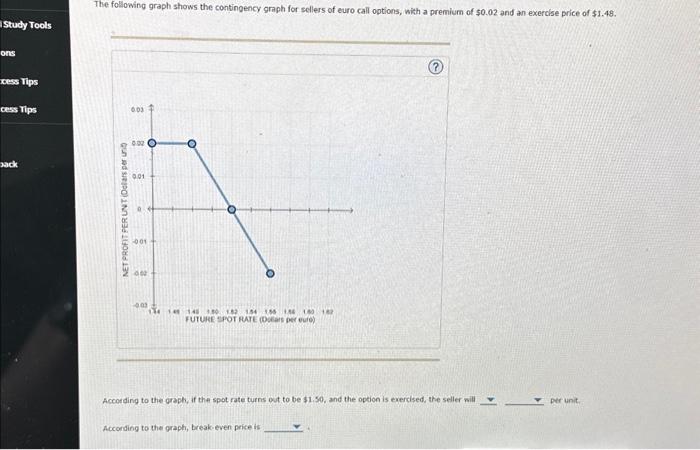
Study Tools ons cess Tips cess Tips back The following graph shows the contingency graph for sellers of euro call options, with a premium of $0.02 and an exercise price of $1.48. NET PROFIT PER UNIT (Dollars per unit) 0.03 0.02 0.01 a -0.01 -0.02 -0.03 1.44 1.48 1.48 1.50 1.52 1.54 1.56 1.58 1.00 1.62 FUTURE SPOT RATE (Dollars per euro) According to the graph, if the spot rate turns out to be $1.50, and the option is exercised, the seller will According to the graph, break-even price is per unit.
Step by Step Solution
There are 3 Steps involved in it
Step: 1

Get Instant Access to Expert-Tailored Solutions
See step-by-step solutions with expert insights and AI powered tools for academic success
Step: 2

Step: 3
Ace Your Homework with AI
Get the answers you need in no time with our AI-driven, step-by-step assistance
Get Started