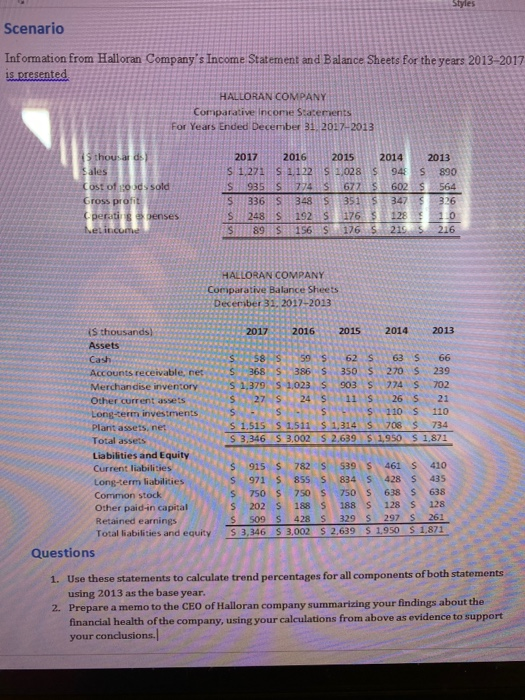
Styles Scenario Information from Halloran Company's Income Statement and Balance Sheets for the years 2013-2017 is presented HALLORAN COMPANY Comparative Income Statements For Years Ended December 31, 2017-2013 15 thousar de Sales Cost of goods sold Gross profit geratis oenses el income 2017 2016 2015 2014 2013 S 1 272 S 1122 S 1,028 $ s 890 S 935 S 774 s 6775 602 S 564 S 336 S S 351 s 347 $ 376 248 S 192 176 S 128 1.0 s 89 S 156 S 176 $ 219 $ 216 348 HALLORAN COMPANY Comparative Balance Sheets December 31, 2017-2013 2017 2016 2015 2014 2013 58S 59 $ 62 S 63 $ 66 368 S 386 S 350 S 270 S 239 S 1,379 S 1,023 S 903 S 774 $ 702 S 27 S 24 $ 11 S 26 S 21 S- s s S 110 S 110 S 1.515 S 1,511 S 1,314 S 708 S 734 S 3,346 S 3,002 S 2,639 5 1,950 $ 1,871 is thousands) Assets Cash Accounts receivable, net Merchandise inventory Other current assets Long-term investments Plant assets, net Total assets Liabilities and Equity Current liabilities Long-term liabilities Common stock Other paid-in capital Retained earnings Total liabilities and equity Questions S 915 $ 782 S 539 $ 461 S 410 S 971 $ 8555 834 S 428 S 435 S 750 S 750 S 750 638 s 202 S 188 S 188 128 s 128 $ 509 S 428 S 329 297 s 261 S 3,346 S 3,002 S 2,639 S 1.950 S 1.871 nun 638 1. Use these statements to calculate trend percentages for all components of both statements using 2013 as the base year. 2. Prepare a memo to the CEO of Halloran company summarizing your findings about the financial health of the company, using your calculations from above as evidence to support your conclusions. Styles Scenario Information from Halloran Company's Income Statement and Balance Sheets for the years 2013-2017 is presented HALLORAN COMPANY Comparative Income Statements For Years Ended December 31, 2017-2013 15 thousar de Sales Cost of goods sold Gross profit geratis oenses el income 2017 2016 2015 2014 2013 S 1 272 S 1122 S 1,028 $ s 890 S 935 S 774 s 6775 602 S 564 S 336 S S 351 s 347 $ 376 248 S 192 176 S 128 1.0 s 89 S 156 S 176 $ 219 $ 216 348 HALLORAN COMPANY Comparative Balance Sheets December 31, 2017-2013 2017 2016 2015 2014 2013 58S 59 $ 62 S 63 $ 66 368 S 386 S 350 S 270 S 239 S 1,379 S 1,023 S 903 S 774 $ 702 S 27 S 24 $ 11 S 26 S 21 S- s s S 110 S 110 S 1.515 S 1,511 S 1,314 S 708 S 734 S 3,346 S 3,002 S 2,639 5 1,950 $ 1,871 is thousands) Assets Cash Accounts receivable, net Merchandise inventory Other current assets Long-term investments Plant assets, net Total assets Liabilities and Equity Current liabilities Long-term liabilities Common stock Other paid-in capital Retained earnings Total liabilities and equity Questions S 915 $ 782 S 539 $ 461 S 410 S 971 $ 8555 834 S 428 S 435 S 750 S 750 S 750 638 s 202 S 188 S 188 128 s 128 $ 509 S 428 S 329 297 s 261 S 3,346 S 3,002 S 2,639 S 1.950 S 1.871 nun 638 1. Use these statements to calculate trend percentages for all components of both statements using 2013 as the base year. 2. Prepare a memo to the CEO of Halloran company summarizing your findings about the financial health of the company, using your calculations from above as evidence to support your conclusions


