Answered step by step
Verified Expert Solution
Link Copied!

Question

1 Approved Answer

Subject: Discreate Structure: 4 points Question 4: A Ven diagram is a graphical tool/representation which uses overlapping circles to show logical relationships b/w two or

Subject: Discreate Structure:
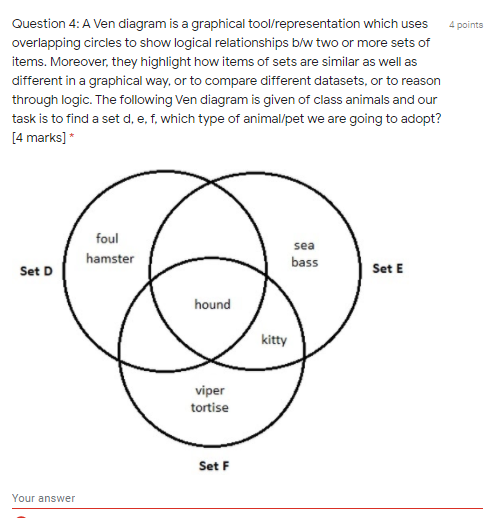
image text in transcribed

4 points Question 4: A Ven diagram is a graphical tool/representation which uses overlapping circles to show logical relationships b/w two or more sets of items. Moreover, they highlight how items of sets are similar as well as different in a graphical way, or to compare different datasets, or to reason through logic. The following Ven diagram is given of class animals and our task is to find a set d, e, f, which type of animal/pet we are going to adopt? [4 marks] * foul hamster sea bass Set D Set E hound kitty viper tortise Set F Your

Step by Step Solution

There are 3 Steps involved in it

Step: 1

blur-text-image

Get Instant Access to Expert-Tailored Solutions

See step-by-step solutions with expert insights and AI powered tools for academic success

Step: 2

blur-text-image

Step: 3

blur-text-image

Ace Your Homework with AI

Get the answers you need in no time with our AI-driven, step-by-step assistance

Get Started

Recommended Textbook for

Temporal Databases Research And Practice Lncs 1399

Authors: Opher Etzion ,Sushil Jajodia ,Suryanarayana Sripada

1st Edition

3540645195, 978-3540645191

More Books

Students also viewed these Databases questions

Question

Create a workflow analysis.

Answered: 1 week ago

Question

Have roles been defined and assigned?

Answered: 1 week ago

Question

Are these written ground rules?

Answered: 1 week ago