Subject: STATISTICS Topic: Analysis of Variance Score: 150 Three different antibiotics are being tested for their effectiveness in reducing bacterial infection. Each antibiotic is administered
Subject: STATISTICS
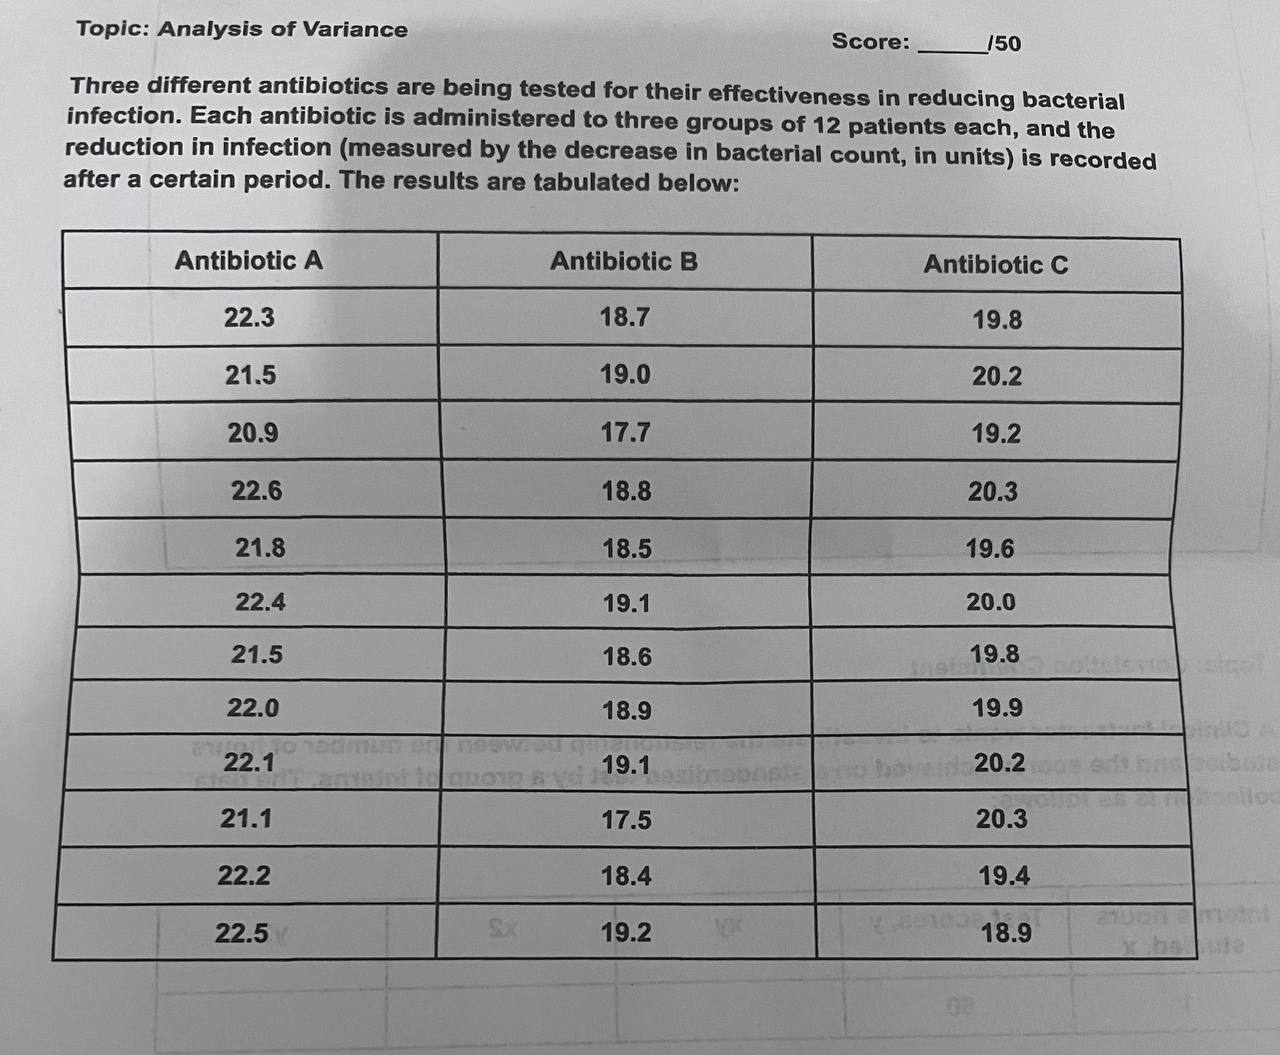
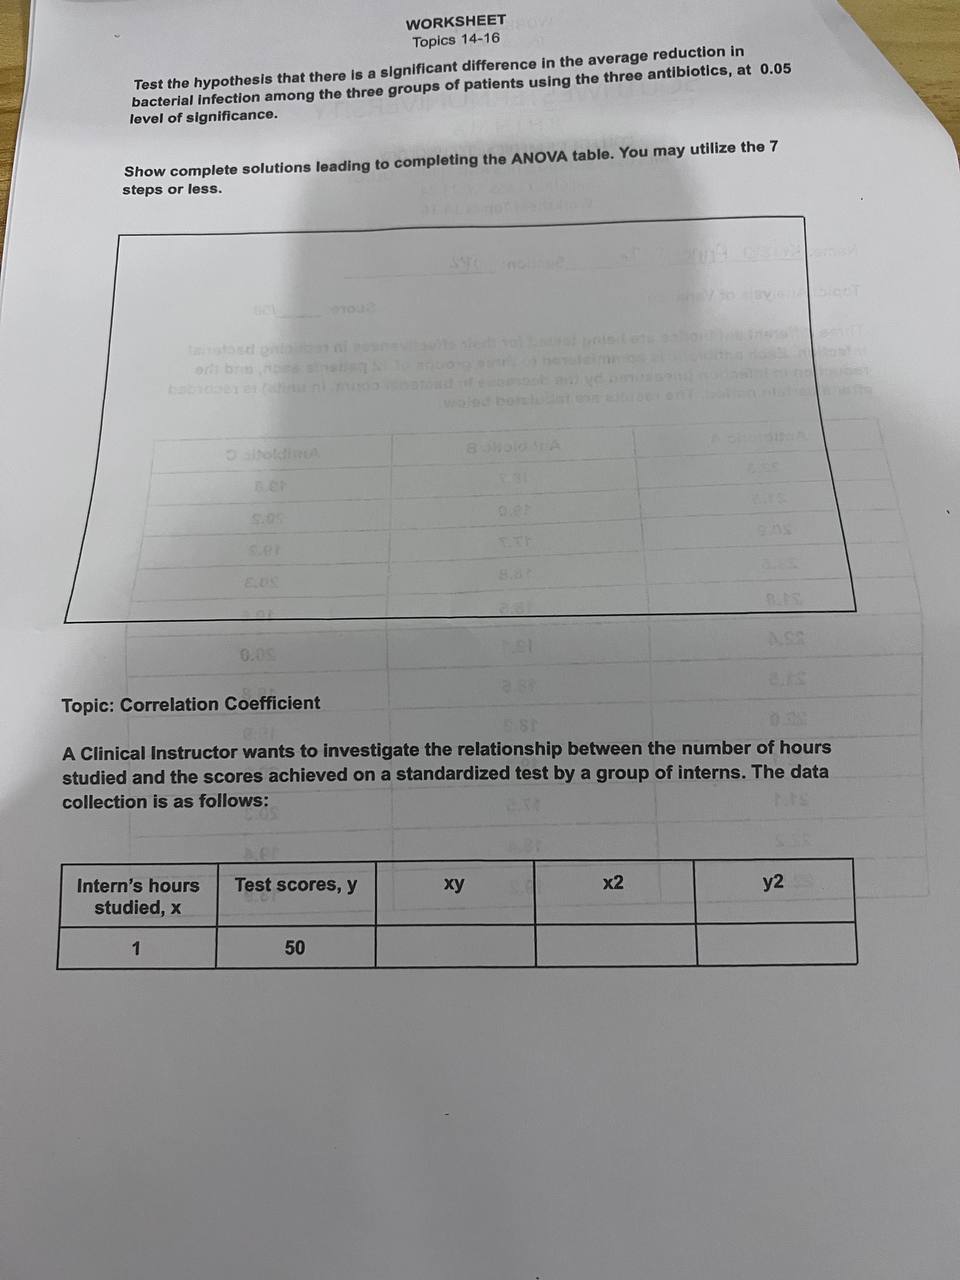
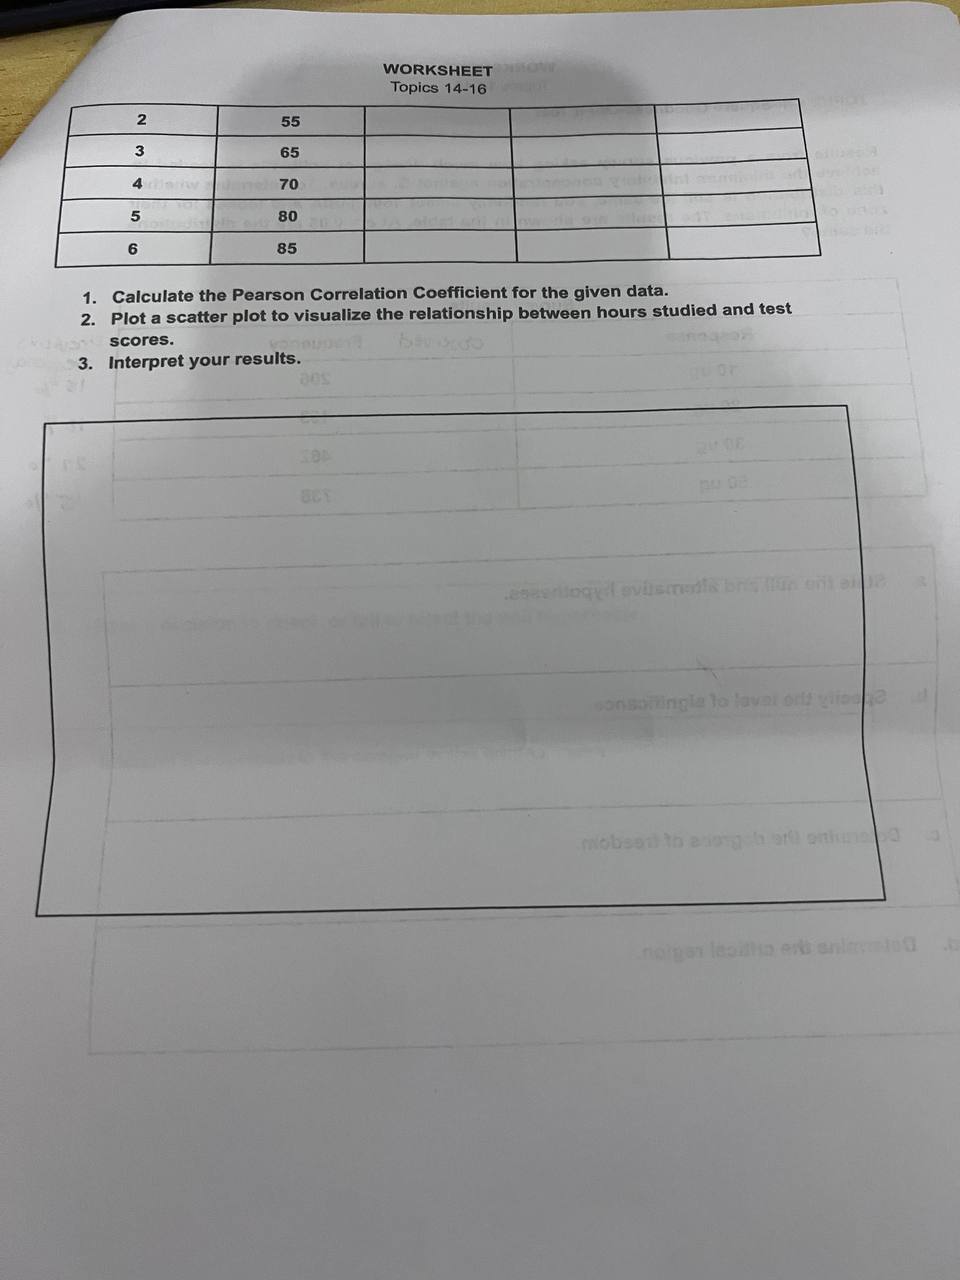
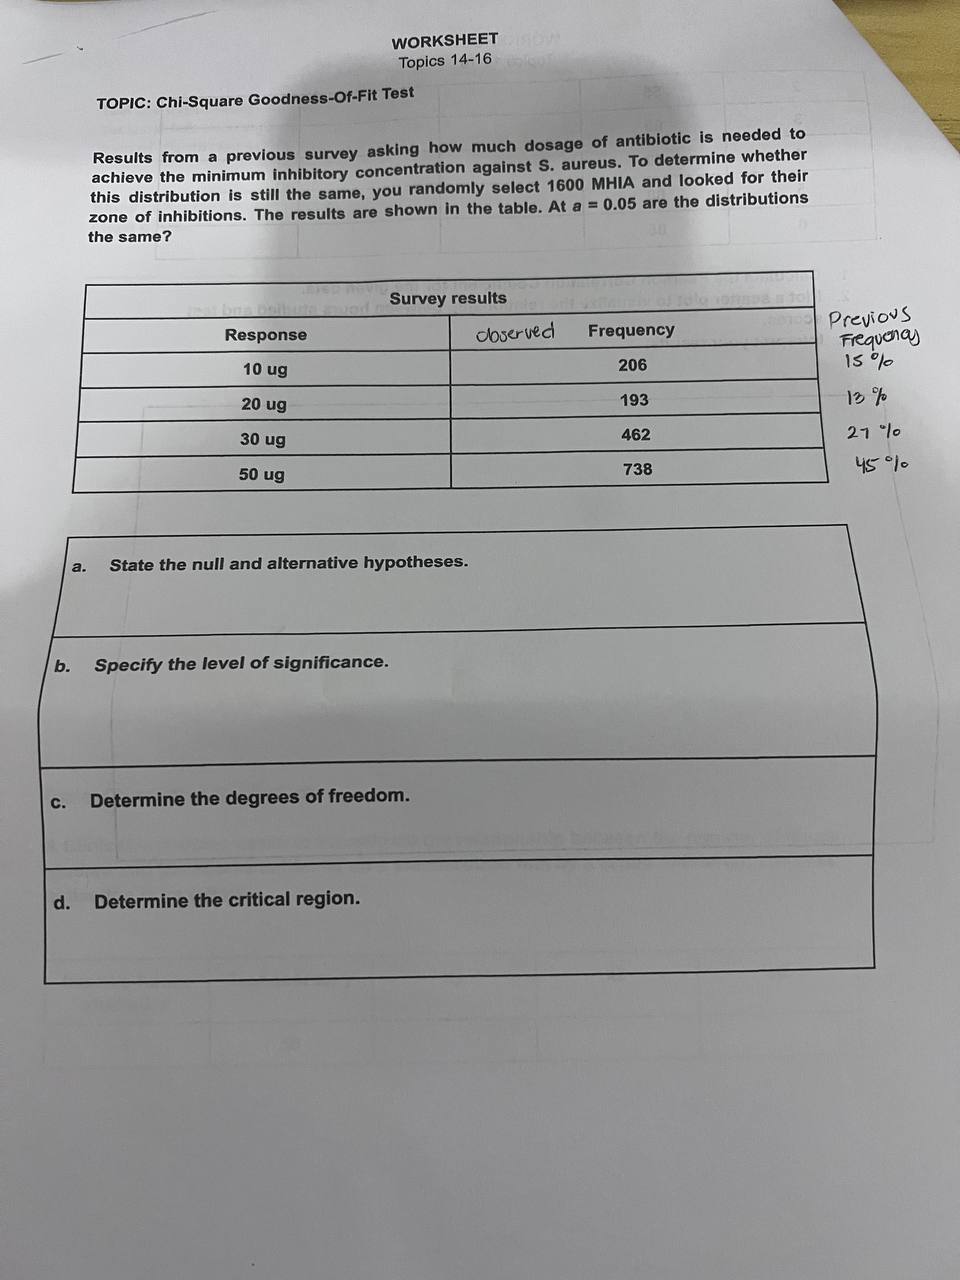
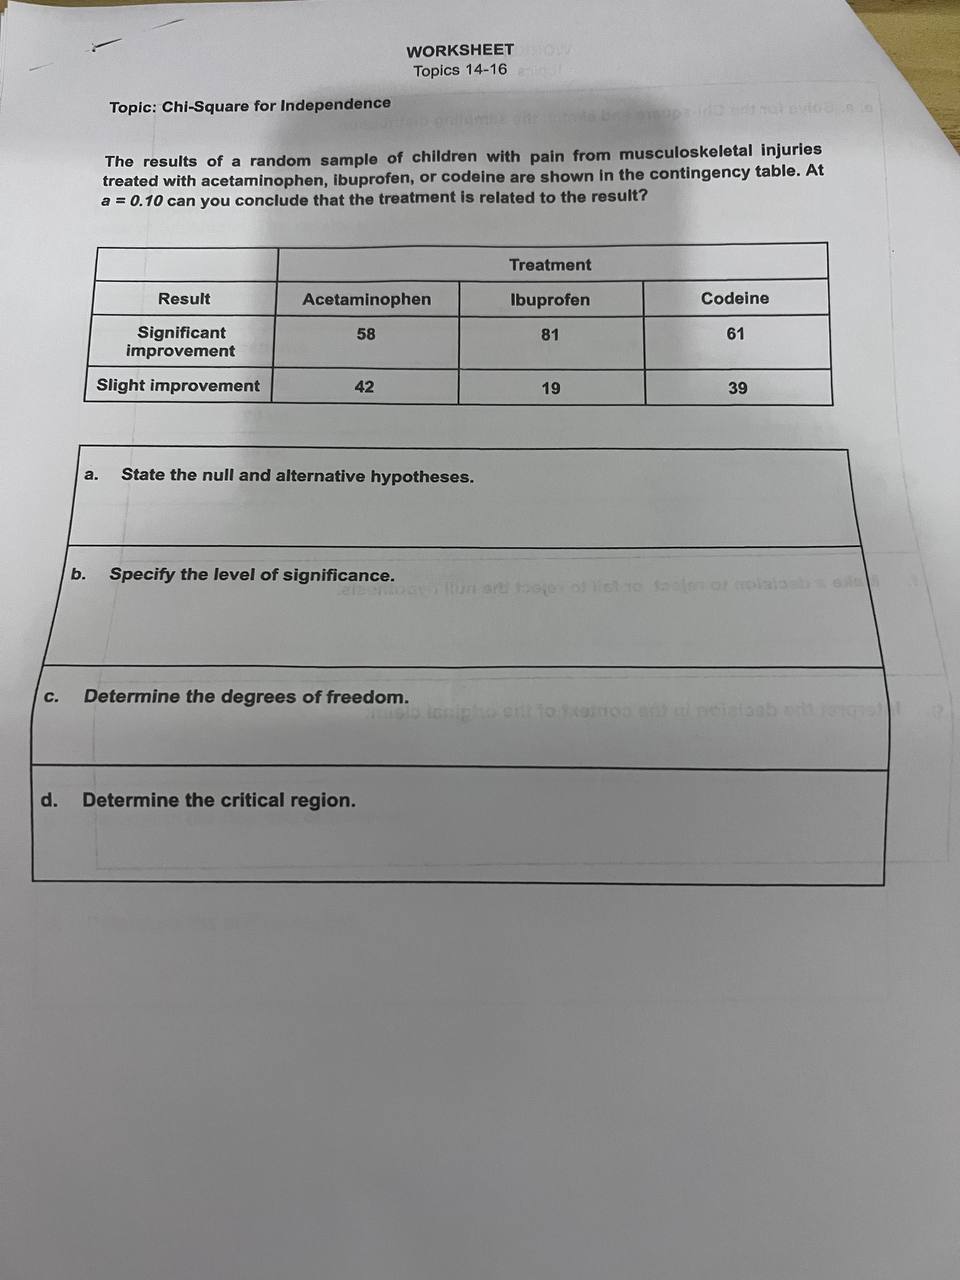
Topic: Analysis of Variance Score: 150 Three different antibiotics are being tested for their effectiveness in reducing bacterial infection. Each antibiotic is administered to three groups of 12 patients each, and the reduction in infection (measured by the decrease in bacterial count, in units) is recorded after a certain period. The results are tabulated below: Antibiotic A Antibiotic B Antibiotic C 22.3 18.7 19.8 21.5 19.0 20.2 20.9 17.7 19.2 22.6 18.8 20.3 21.8 18.5 19.6 22.4 19.1 20.0 21.5 18.6 19.8 22.0 18.9 19.9 22.1 19.1 20.2 21.1 17.5 20.3 22.2 18.4 19.4 22.5 SX 19.2 18.9WORKSHEET Topics 14-16 Test the hypothesis that there is a significant difference in the average reduction in bacterial Infection among the three groups of patients using the three antibiotics, at 0.05 level of significance. Show complete solutions leading to completing the ANOVA table. You may utilize the 7 steps or less. tallabed ontoits maine 0.09 A.SR. Topic: Correlation Coefficient A Clinical Instructor wants to investigate the relationship between the number of hours studied and the scores achieved on a standardized test by a group of interns. The data collection is as follows: Intern's hours Test scores, y xy x2 studied, x y2 50WORKSHEET Topics 14-16 N 55 W 65 70 80 6 85 . Calculate the Pearson Correlation Coefficient for the given data. 2. Plot a scatter plot to visualize the relationship between hours studied and test scores. 3. Interpret your results. RINGE onsowingla to laver off gladeWORKSHEET Topics 14-16 TOPIC: Chi-Square Goodness-Of-Fit Test Results from a previous survey asking how much dosage of antibiotic is needed to achieve the minimum inhibitory concentration against S. aureus. To determine whether this distribution is still the same, you randomly select 1600 MHIA and looked for their zone of inhibitions. The results are shown in the table. At a = 0.05 are the distributions the same? Survey results Response observed Frequency Previous Frequency 10 ug 206 15 0 20 ug 193 13 % 30 ug 462 27 10 50 ug 738 45 010 a. State the null and alternative hypotheses. b. Specify the level of significance. c. Determine the degrees of freedom. d. Determine the critical region.WORKSHEET Topics 14-16 e. a. Solve for the Chi-square and sketch the sampling distribution. listgin to lavel on f. Make a decision to reject or fail to reject the null hypothesis. g. Interpret the decision in the context of the original claim.WORKSHEET Topics 14-16 Topic: Chi-Square for Independence The results of a random sample of children with pain from musculoskeletal injuries treated with acetaminophen, ibuprofen, or codeine are shown in the contingency table. At a = 0.10 can you conclude that the treatment is related to the result? Treatment Result Acetaminophen Ibuprofen Codeine Significant 58 81 61 improvement Slight improvement 42 19 39 a. State the null and alternative hypotheses. b. Specify the level of significance. c. Determine the degrees of freedom. d. Determine the critical region.WORKSHEET Topics 14-16 e. a. Solve for the Chi-square and sketch the sampling distribution. f . Make a decision to reject or fail to reject the null hypothesis. g. Interpret the decision in the context of the original claim
Step by Step Solution
There are 3 Steps involved in it
Step: 1
Get Instant Access to Expert-Tailored Solutions
See step-by-step solutions with expert insights and AI powered tools for academic success
Step: 2
Step: 3
Ace Your Homework with AI
Get the answers you need in no time with our AI-driven, step-by-step assistance