Submission Requirements (from page 268)
- Requirement A-Cover Sheet/Summary of Financial Statement Ratios
- Requirement B-Analyze the Ratios and prepare a summary report that addresses each of the following areas:
- Short-term Liquidity
- Operating Efficiency
- Capital Structure and Long-term Solvency
- Profitability
- Market Measures
- Company Strengths/Weaknesses
- Investment Potential
- Credit Worthiness
- Requirement B-Summary Requirement
- 3-Page Summary
- Double Spaced, Font Size 11
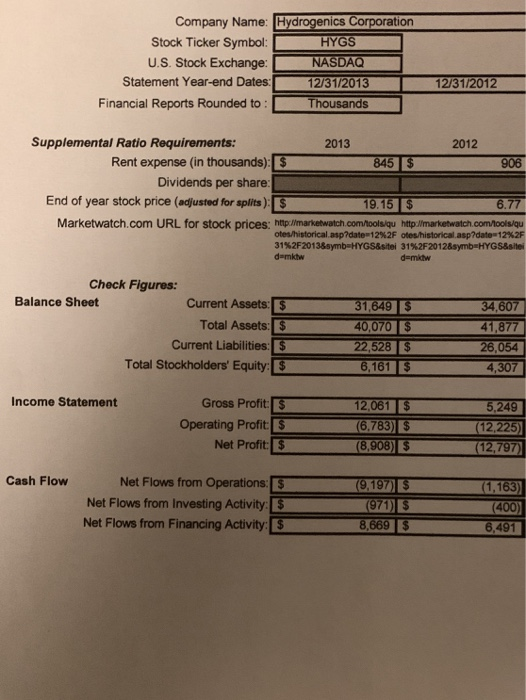
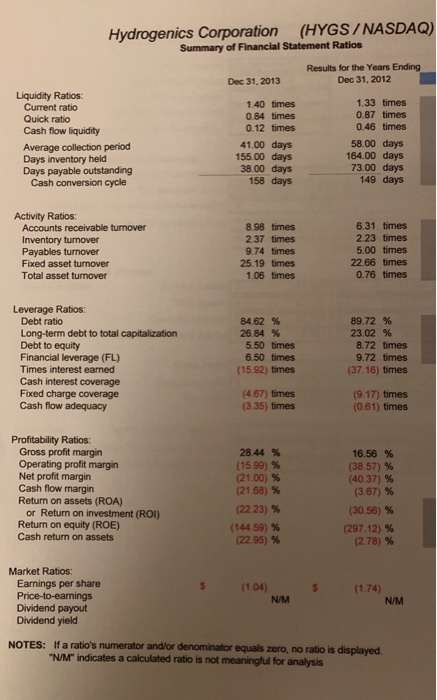
Company Name: Hydrogenics Corporation Stock Ticker Symbol: HYGS U.S. Stock Exchange: NASDAQ Statement Year-end Dates: 12/31/2013 Financial Reports Rounded to: Thousands 12/31/2012 Supplemental Ratio Requirements: 2013 2012 Rent expense (in thousands): S 8 45$ 906 Dividends per share: End of year stock price (adjusted for splits): $ 19.15 $ 6.77 Marketwatch.com URL for stock prices: http://marketwatch.com/tools.qu http://marketwatch.com/hools/qu otes/historical.asp?date=12%2F otes historical.asp?date=12%2F 31%2F20138symb-HYGS&sitei 31%2F2012&symbuHYGS&site demkw demkw Check Figures: Balance Sheet Current Assets: 5 Total Assets: 5 Current Liabilities: 5 Total Stockholders' Equity: $ 31,649S 40,070 $ 22,528 $ 6,1613 34,607 41,877 26,054 4,307 Income Statement Gross Profits Operating Profits Net Profit $ 12,061 S (6.783) $ (8,908) S 5,249 (12,225) (12,797) Cash Flow Net Flows from Operations: S Net Flows from Investing Activity: 5 Net Flows from Financing Activity: S (9,197) (971) S 8,669 S (1,163) (400) 6,491 Hydrogenics Corporation (HYGS/NASDAQ) Summary of Financial Statement Ratios Results for the Years Ending Dec 31, 2012 Dec 31, 2013 Liquidity Ratios: Current ratio Quick ratio Cash flow liquidity Average collection period Days inventory held Days payable outstanding Cash conversion cycle 1.40 times 0.84 times 0.12 times 41.00 days 155.00 days 38.00 days 158 days 1.33 times 0.87 times 0.46 times 58.00 days 164.00 days 73.00 days 149 days Activity Ratios: Accounts receivable turnover Inventory turnover Payables turnover Fixed asset turnover Total asset turnover 8.98 times 2.37 times 9.74 times 25.19 times 1.06 times 6.31 times 2.23 times 5.00 times 22.66 times 0.76 times Leverage Ratios: Debt ratio Long-term debt to total capitalization Debt to equity Financial leverage (FL) Times interest earned Cash interest coverage Fixed charge coverage Cash flow adequacy 84.62% 26.84 % 5.50 times 6.50 times (15.92) times 89.72 % 23.02 % 8.72 times 9.72 times (37.16) times (4.67) times (3.35) times (9.17) times (0.61) times Profitability Ratios: Gross profit margin Operating profit margin Net profit margin Cash flow margin Return on assets (ROA) or Return on investment (ROI) Return on equity (ROE) Cash return on assets 28.44 % (15.99) % (21.00) % (21.68) % (2223) % (144.59) % (22.95) % 16.56 % (38.57) % (40.37) % (3.67) % (30.56) % (297.12) % (2.78) % Market Ratios: Earnings per share Price-to-earnings Dividend payout Dividend yield (1.04) N/M S (1.74) N/M NOTES: If a ratio's numerator and/or denominator equals zero, no ratio is displayed "N/M" indicates a calculated ratio is not meaningful for analysis Company Name: Hydrogenics Corporation Stock Ticker Symbol: HYGS U.S. Stock Exchange: NASDAQ Statement Year-end Dates: 12/31/2013 Financial Reports Rounded to: Thousands 12/31/2012 Supplemental Ratio Requirements: 2013 2012 Rent expense (in thousands): S 8 45$ 906 Dividends per share: End of year stock price (adjusted for splits): $ 19.15 $ 6.77 Marketwatch.com URL for stock prices: http://marketwatch.com/tools.qu http://marketwatch.com/hools/qu otes/historical.asp?date=12%2F otes historical.asp?date=12%2F 31%2F20138symb-HYGS&sitei 31%2F2012&symbuHYGS&site demkw demkw Check Figures: Balance Sheet Current Assets: 5 Total Assets: 5 Current Liabilities: 5 Total Stockholders' Equity: $ 31,649S 40,070 $ 22,528 $ 6,1613 34,607 41,877 26,054 4,307 Income Statement Gross Profits Operating Profits Net Profit $ 12,061 S (6.783) $ (8,908) S 5,249 (12,225) (12,797) Cash Flow Net Flows from Operations: S Net Flows from Investing Activity: 5 Net Flows from Financing Activity: S (9,197) (971) S 8,669 S (1,163) (400) 6,491 Hydrogenics Corporation (HYGS/NASDAQ) Summary of Financial Statement Ratios Results for the Years Ending Dec 31, 2012 Dec 31, 2013 Liquidity Ratios: Current ratio Quick ratio Cash flow liquidity Average collection period Days inventory held Days payable outstanding Cash conversion cycle 1.40 times 0.84 times 0.12 times 41.00 days 155.00 days 38.00 days 158 days 1.33 times 0.87 times 0.46 times 58.00 days 164.00 days 73.00 days 149 days Activity Ratios: Accounts receivable turnover Inventory turnover Payables turnover Fixed asset turnover Total asset turnover 8.98 times 2.37 times 9.74 times 25.19 times 1.06 times 6.31 times 2.23 times 5.00 times 22.66 times 0.76 times Leverage Ratios: Debt ratio Long-term debt to total capitalization Debt to equity Financial leverage (FL) Times interest earned Cash interest coverage Fixed charge coverage Cash flow adequacy 84.62% 26.84 % 5.50 times 6.50 times (15.92) times 89.72 % 23.02 % 8.72 times 9.72 times (37.16) times (4.67) times (3.35) times (9.17) times (0.61) times Profitability Ratios: Gross profit margin Operating profit margin Net profit margin Cash flow margin Return on assets (ROA) or Return on investment (ROI) Return on equity (ROE) Cash return on assets 28.44 % (15.99) % (21.00) % (21.68) % (2223) % (144.59) % (22.95) % 16.56 % (38.57) % (40.37) % (3.67) % (30.56) % (297.12) % (2.78) % Market Ratios: Earnings per share Price-to-earnings Dividend payout Dividend yield (1.04) N/M S (1.74) N/M NOTES: If a ratio's numerator and/or denominator equals zero, no ratio is displayed "N/M" indicates a calculated ratio is not meaningful for analysis