Submit a written paper which is 2-3 pages in length, exclusive of the reference page. Papers should be double spaced in Times New Roman font which is no greater than 12 points in size. The paper should cite at least one source independent of the textbook.
Case Study
Comic book sales have hit record highs due to the volume of comic book-based movies achieving great success. With each new movie and character announcement, collectors and investors feed off the speculation. Many collectors send their books for grading, certification, and encapsulation to protect their investments. The Exceptional Service Grading Company provides those services and wants to expand to assessing other publication formats, such as certifying large magazines and movie posters.
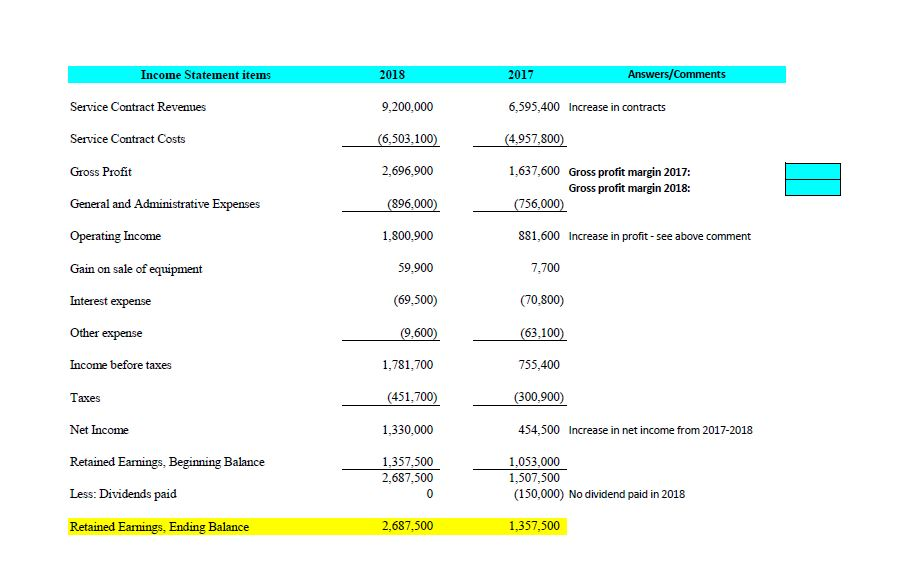
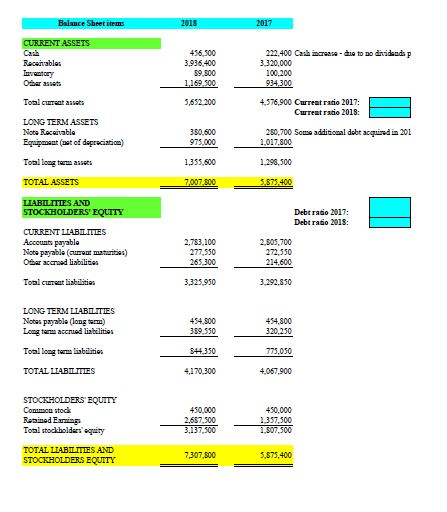
What is the companys financial position? Please refer to the income statement and balance sheet for the Exceptional Service Grading Company available here. Using the learning resources provided in the Reading Assignment, perform a financial ratio analysis of the company using the following ratios:
- Gross profit margin
- Current ratio
- Debt ratio
Locate two other ratios to calculate. Define them and explain their purpose and how they add value to your analysis.
Select significant lines from the financial statements and provide an observation of their trends. For example, if the account is increasing or decreasing in value, what would that indicate?
- Draw some conclusions based on your observations. For example:
- Is there any viability for a new project?
- Why do you think the assets of the company went up from 2017 to 2018?
- What implications does this have?
- What follow-up questions do you have to ask the companys management?
Superior papers will:
- Provide correct values for calculations.
- Explain your approach to the problem.
- Support your approach with references, and execute your approach.
- Provide an answer to the case study questions with a recommendation.
Income Statement items 2018 2017 Answers/Comments Service Contract Revenues 9,200,000 6,595,400 Increase in contracts Service Contract Costs (6,503,100) (4,957,800) Gross Profit 2,696.900 1,637,600 Gross profit margin 2017: Gross profit margin 2018: (756,000) General and Administrative Expenses (896.000) Operating Income 1.800.900 881,600 Increase in profit - see above comment 59.900 7.700 Gain on sale of equipment Interest expense (69.500) (70.800) Other expense (9.600) (63,100) Income before taxes 1,781,700 755,400 Taxes (451,700) (300,900) Net Income 1,330.000 454,500 Increase in net income from 2017-2018 Retained Earnings, Beginning Balance 1,357,500 2,687,500 0 1,053,000 1,507,500 (150,000) No dividend paid in 2018 Less: Dividends paid Retained Earnings, Ending Balance 2,687,500 1,357,500 Balance Sheet items 2018 2017 CURRENT ASSETS Recenables 456.500 3,936,400 $9.500 1.169.500 222,400 Cash increase-dte to no dhideadap 3,320,000 100,200 934,300 Other assets Total ciment assets 5,652 200 4,576,900 Current ratio 2017: Current ratio 2018: LONG TERM ASSETS Note Receitable Equipment (ast of depreciation) 380.500 975.000 280,700 Some additional debt acquired in 201 1,017,800 1,355,600 1.298,500 Toallong term assets TOTAL ASSETS 7,007 500 5.875.400 Debt ratio 2017: Debt ratio 2018: LIABILITIES AND STOCKHOLDERS' EQUITY CURRENT LIABILITIES Accounts payable Note payable (current materies) Other accroed liabilities 2,783.100 277,550 265.300 2.805,700 272.550 214.600 Toalcatent liabilities 3,325.950 3.292.850 LONG TERM LIABILITIES Notas payable (long term Long term accrued liabilities 454.500 359.550 454,800 320.250 Toal long term liabilities 344350 775,050 TOTAL LIABILITIES 4,170,300 4,067.900 STOCKHOLDERS' EQUITY Common stock Retained Earning Total stockholders' equity 450.000 2.687.500 3.137.500 450,000 1,357,500 1.807,500 TOTAL LIABILITIES AND STOCKHOLDERS EQUITY 7,307,500 5.875,400 Income Statement items 2018 2017 Answers/Comments Service Contract Revenues 9,200,000 6,595,400 Increase in contracts Service Contract Costs (6,503,100) (4,957,800) Gross Profit 2,696.900 1,637,600 Gross profit margin 2017: Gross profit margin 2018: (756,000) General and Administrative Expenses (896.000) Operating Income 1.800.900 881,600 Increase in profit - see above comment 59.900 7.700 Gain on sale of equipment Interest expense (69.500) (70.800) Other expense (9.600) (63,100) Income before taxes 1,781,700 755,400 Taxes (451,700) (300,900) Net Income 1,330.000 454,500 Increase in net income from 2017-2018 Retained Earnings, Beginning Balance 1,357,500 2,687,500 0 1,053,000 1,507,500 (150,000) No dividend paid in 2018 Less: Dividends paid Retained Earnings, Ending Balance 2,687,500 1,357,500 Balance Sheet items 2018 2017 CURRENT ASSETS Recenables 456.500 3,936,400 $9.500 1.169.500 222,400 Cash increase-dte to no dhideadap 3,320,000 100,200 934,300 Other assets Total ciment assets 5,652 200 4,576,900 Current ratio 2017: Current ratio 2018: LONG TERM ASSETS Note Receitable Equipment (ast of depreciation) 380.500 975.000 280,700 Some additional debt acquired in 201 1,017,800 1,355,600 1.298,500 Toallong term assets TOTAL ASSETS 7,007 500 5.875.400 Debt ratio 2017: Debt ratio 2018: LIABILITIES AND STOCKHOLDERS' EQUITY CURRENT LIABILITIES Accounts payable Note payable (current materies) Other accroed liabilities 2,783.100 277,550 265.300 2.805,700 272.550 214.600 Toalcatent liabilities 3,325.950 3.292.850 LONG TERM LIABILITIES Notas payable (long term Long term accrued liabilities 454.500 359.550 454,800 320.250 Toal long term liabilities 344350 775,050 TOTAL LIABILITIES 4,170,300 4,067.900 STOCKHOLDERS' EQUITY Common stock Retained Earning Total stockholders' equity 450.000 2.687.500 3.137.500 450,000 1,357,500 1.807,500 TOTAL LIABILITIES AND STOCKHOLDERS EQUITY 7,307,500 5.875,400