Subtheme #3 CODE
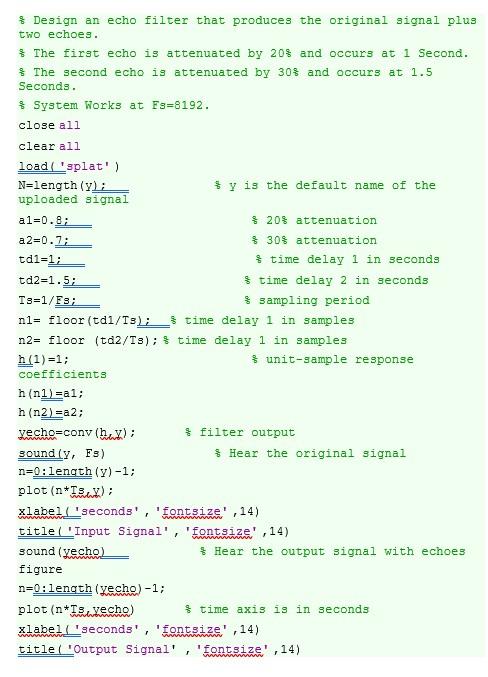
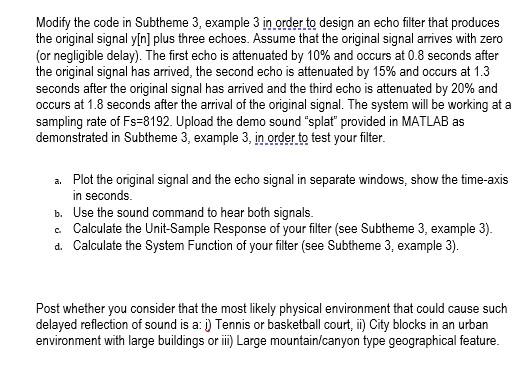
Design an echo filter that produces the original signal plus two echoes. The first echo is attenuated by 203 and occurs at 1 Second. The second echo is attenuated by 30% and occurs at 1.5 Seconds. System Works at Fs=8192. close all clear all load 'splat') N=length(); $y is the default name of the uploaded signal al=0.8; 20% attenuation a2=0.71 $ 30% attenuation td1=1; time delay 1 in seconds td2=1.5; $ time delay 2 in seconds Ts=1/F3; sampling period n1= floor (tdi/Is);_$time delay 1 in samples n2= floor (td2/T3); } time delay 1 in samples h(1)=1; $unit-sample response coefficients h(nl) =a1; h(n2) =a2; vecho=conv (hu); $filter output sound (Y, FS) Hear the original signal n=0: length(y)-1; plot (n*18x); xlabeil seconds', fontsize title( 'Input Signal', 'fontsize' ,14) sound (yesho Hear the output signal with echoes figure n=0:length (vecho)-1; plot (n*Texecho) $ time axis is in seconds xlabei seconds', 'Fontsize' ,14) title ( "Output Signal','fontsize',14) 14) Modify the code in Subtheme 3, example 3 in order to design an echo filter that produces the original signal y[n] plus three echoes. Assume that the original signal arrives with zero (or negligible delay). The first echo is attenuated by 10% and occurs at 0.8 seconds after the original signal has arrived, the second echo is attenuated by 15% and occurs at 1.3 seconds after the original signal has arrived and the third echo is attenuated by 20% and occurs at 1.8 seconds after the arrival of the original signal. The system will be working at a sampling rate of Fs=8192. Upload the demo sound "splat provided in MATLAB as demonstrated in Subtheme 3, example 3, in order to test your filter. a. Plot the original signal and the echo signal in separate windows, show the time-axis in seconds. b. Use the sound command to hear both signals. c Calculate the Unit-Sample Response of your filter (see Subtheme 3, example 3). d. Calculate the System Function of your filter (see Subtheme 3. example 3). Post whether you consider that the most likely physical environment that could cause such delayed reflection of sound is a: 1) Tennis or basketball court, ii) City blocks in an urban environment with large buildings or ii) Large mountain/canyon type geographical feature. Design an echo filter that produces the original signal plus two echoes. The first echo is attenuated by 203 and occurs at 1 Second. The second echo is attenuated by 30% and occurs at 1.5 Seconds. System Works at Fs=8192. close all clear all load 'splat') N=length(); $y is the default name of the uploaded signal al=0.8; 20% attenuation a2=0.71 $ 30% attenuation td1=1; time delay 1 in seconds td2=1.5; $ time delay 2 in seconds Ts=1/F3; sampling period n1= floor (tdi/Is);_$time delay 1 in samples n2= floor (td2/T3); } time delay 1 in samples h(1)=1; $unit-sample response coefficients h(nl) =a1; h(n2) =a2; vecho=conv (hu); $filter output sound (Y, FS) Hear the original signal n=0: length(y)-1; plot (n*18x); xlabeil seconds', fontsize title( 'Input Signal', 'fontsize' ,14) sound (yesho Hear the output signal with echoes figure n=0:length (vecho)-1; plot (n*Texecho) $ time axis is in seconds xlabei seconds', 'Fontsize' ,14) title ( "Output Signal','fontsize',14) 14) Modify the code in Subtheme 3, example 3 in order to design an echo filter that produces the original signal y[n] plus three echoes. Assume that the original signal arrives with zero (or negligible delay). The first echo is attenuated by 10% and occurs at 0.8 seconds after the original signal has arrived, the second echo is attenuated by 15% and occurs at 1.3 seconds after the original signal has arrived and the third echo is attenuated by 20% and occurs at 1.8 seconds after the arrival of the original signal. The system will be working at a sampling rate of Fs=8192. Upload the demo sound "splat provided in MATLAB as demonstrated in Subtheme 3, example 3, in order to test your filter. a. Plot the original signal and the echo signal in separate windows, show the time-axis in seconds. b. Use the sound command to hear both signals. c Calculate the Unit-Sample Response of your filter (see Subtheme 3, example 3). d. Calculate the System Function of your filter (see Subtheme 3. example 3). Post whether you consider that the most likely physical environment that could cause such delayed reflection of sound is a: 1) Tennis or basketball court, ii) City blocks in an urban environment with large buildings or ii) Large mountain/canyon type geographical feature