summarize each and how/what is describes in the data.
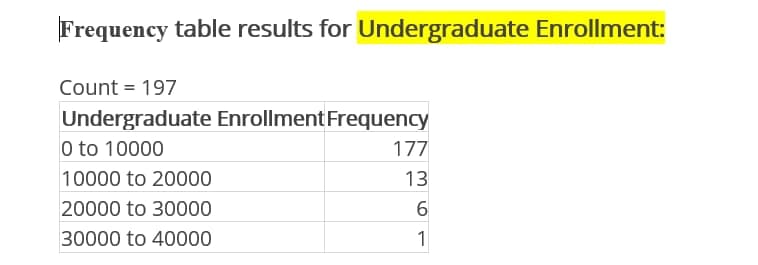
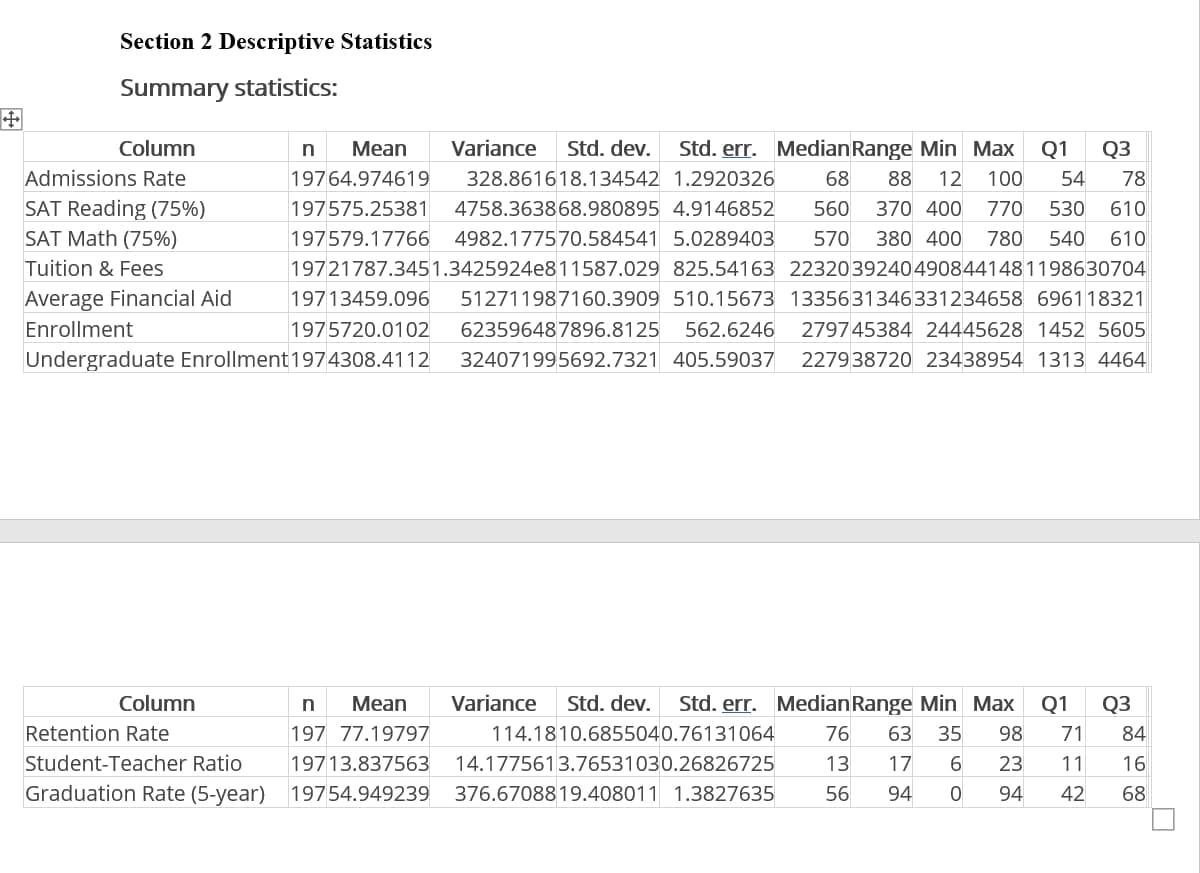
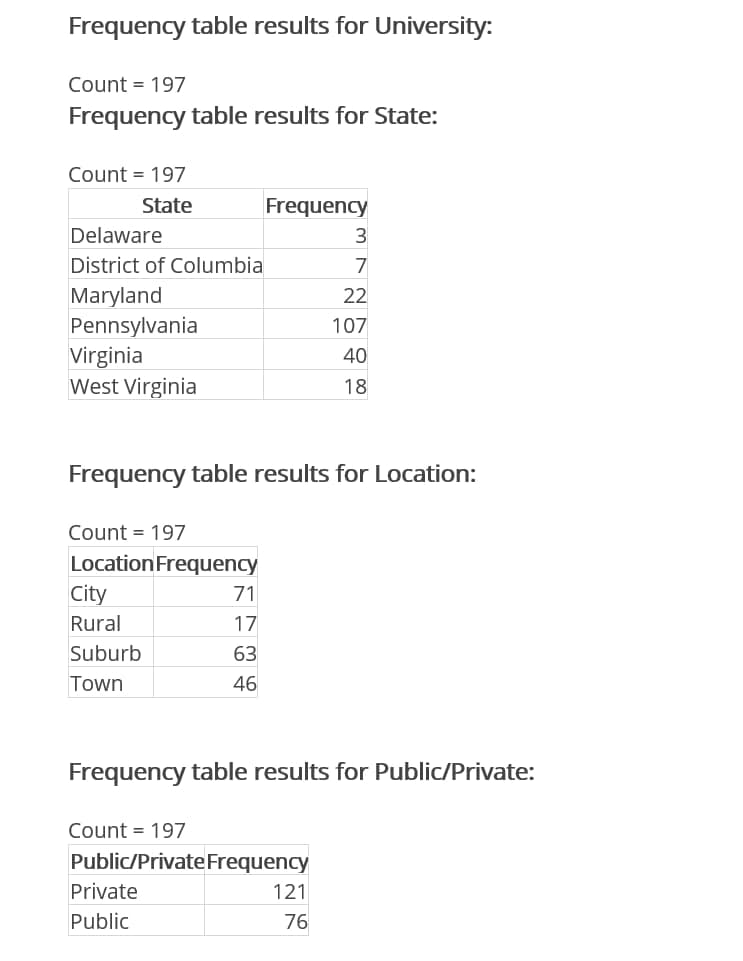
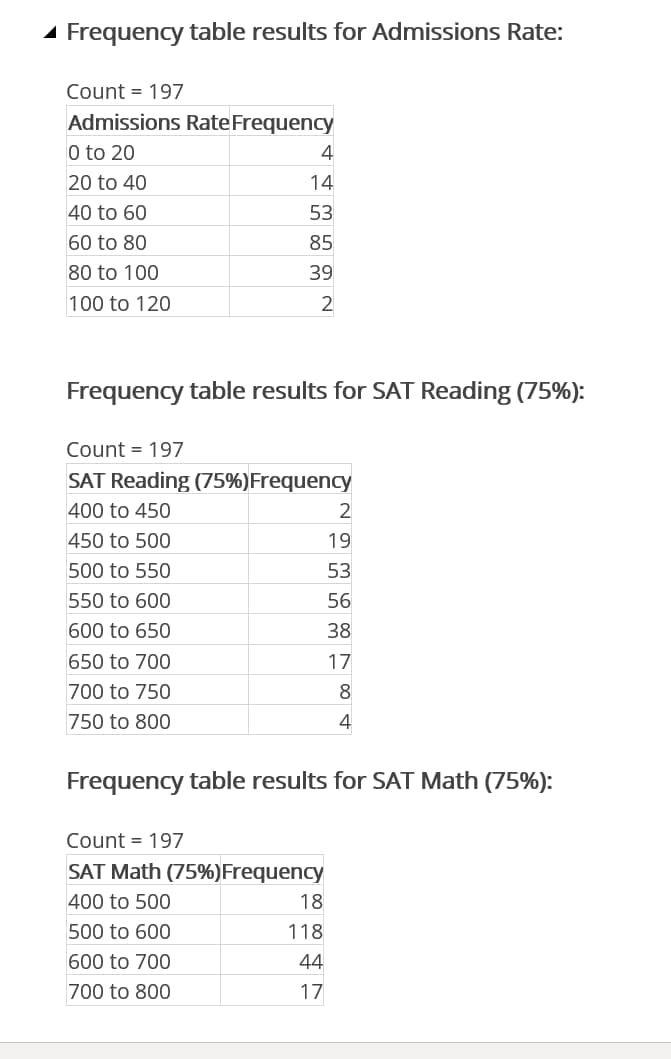
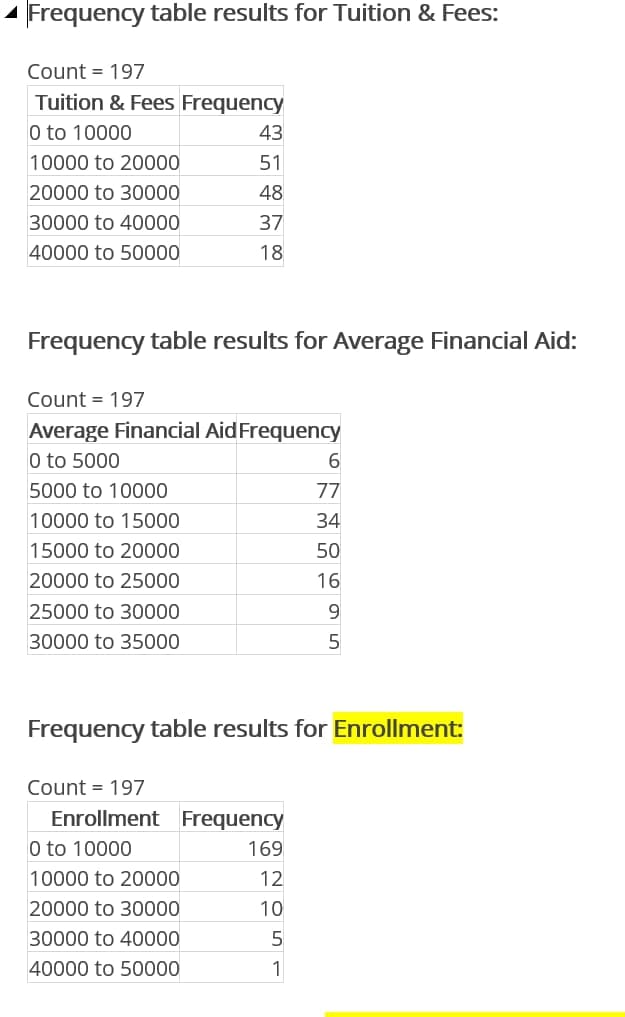
Frequency table results for Undergraduate Enrollment: Count = 197 Undergraduate Enrollment Frequency 0 to 10000 177 10000 to 20000 13 20000 to 30000 6 30000 to 40000Section 2 Descriptive Statistics Summary statistics: Column n Mean Variance Std. dev. Std. err. MedianRange Min Max Q1 Q3 Admissions Rate 19764.974619 328.8616 18.134542 1.2920326 68 88 12 100 54 78 SAT Reading (75%) 197575.25381 4758.363868.980895 4.9146852 560 370 400 770 530 610 SAT Math (75%) 197 579.17766 4982.177570.584541 5.0289403 570 380 400 780 540 610 Tuition & Fees 197 21787.3451.3425924e811587.029 825.54163 2232039240490844148 1198630704 Average Financial Aid 197 13459.096 512711987160.3909 510.15673 1335631346331234658 6961 18321 Enrollment 1975720.0102 623596487896.8125 562.6246 2797 45384 24445628 1452 5605 Undergraduate Enrollment 197 4308.4112 324071995692.7321 405.59037 227938720 23438954 1313 4464 Column n Mean Variance Std. dev. Std. err. MedianRange Min Max Q1 Q3 Retention Rate 197 77.19797 114.18 10.6855040.76131064 76 63 35 98 71 84 Student-Teacher Ratio 197 13.837563 14.1775613.76531030.26826725 13 17 6 23 11 16 Graduation Rate (5-year) 19754.949239 376.67088 19.408011 1.3827635 56 94 0 94 42 68Frequency table results for University: Count = 197 Frequency table results for State: Count = 197 State Frequency Delaware 3 District of Columbia 7 Maryland 22 Pennsylvania 107 Virginia 40 West Virginia 18 Frequency table results for Location: Count = 197 Location Frequency City 71 Rural 17 Suburb 63 Town 46 Frequency table results for Public/Private: Count = 197 Public/Private Frequency Private 121 Public 76Frequency table results for Admissions Rate: Count = 197 Admissions Rate Frequency 0 to 20 4 20 to 40 14 40 to 60 53 60 to 80 85 80 to 100 39 100 to 120 2 Frequency table results for SAT Reading (75%): Count = 197 SAT Reading (75%) Frequency 400 to 450 2 450 to 500 19 500 to 550 53 550 to 600 56 600 to 650 38 650 to 700 17 700 to 750 8 750 to 800 4 Frequency table results for SAT Math (75%): Count = 197 SAT Math (75%) Frequency 400 to 500 18 500 to 600 118 600 to 700 44 700 to 800 171 Frequency table results for Tuition 3: Fees: Count = 197 _ Tuition 8: Fees Frequency. 0 to 10000 _ 43 10000 to 20000 51 20000 1'0 30000 48: 30000 to 40000 37' 40000 to 50000 18: Frequency table results for Average Financial Aid: Count = 197 Average Financial AidFrequency 0 to 5000 _ 5: 5000 to 10000 . 77 _10000 to 15000 _ 34; _1 5000 to 20000 _ 50; :20000 to 25000 _ 15; 25000 to 30000 _ 93 30000 to 35000 _ 5- Frequency table results for Enrollment Count = 197 _ Enrollment Frequency :0 to 10000 _ 159. _1 0000 to 20000 12 '20000 to 30000 10' 30000 to 40000 5: 40000 to 50000 1