

Answered step by step
Verified Expert Solution
Question
1 Approved Answer
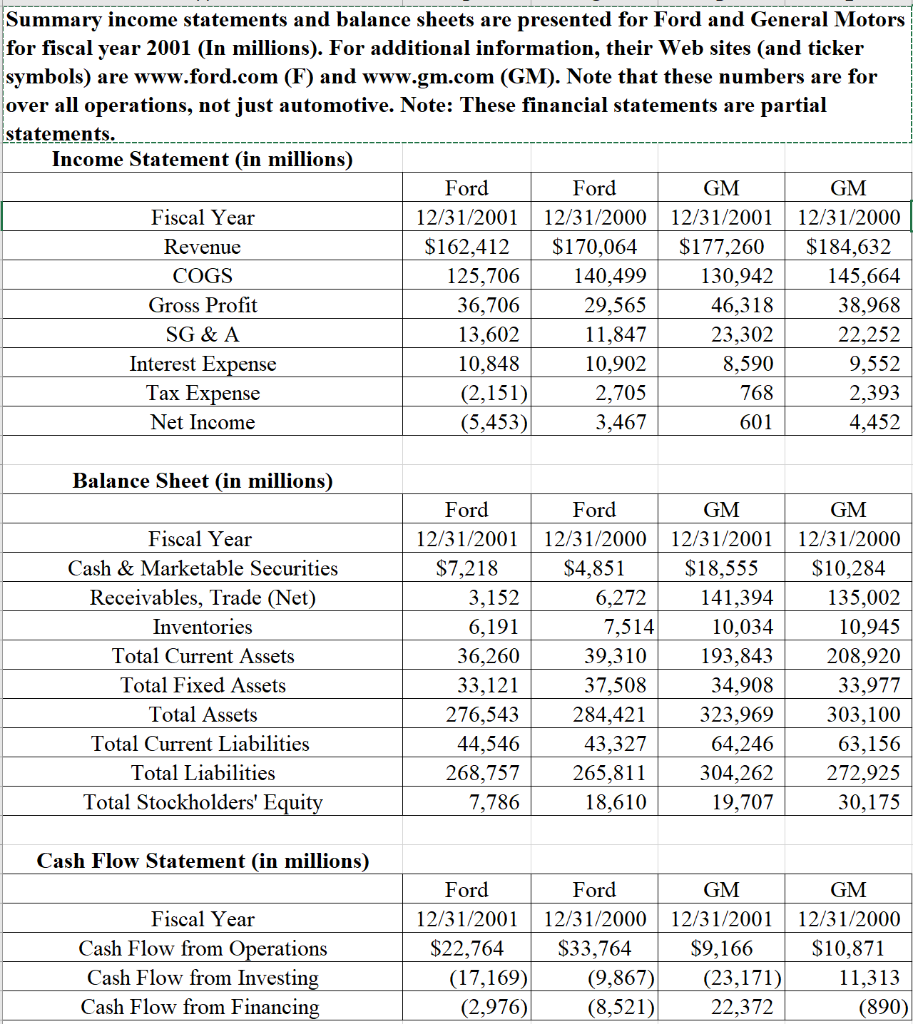
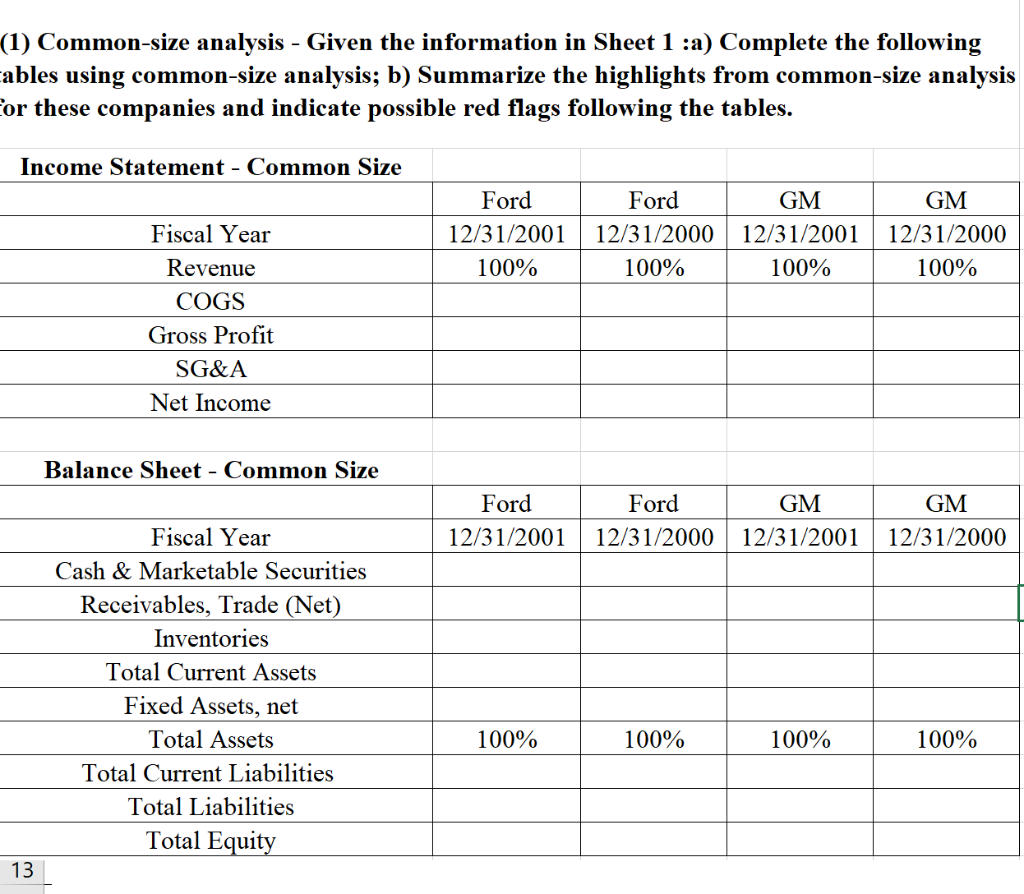
Summary income statements and balance sheets are presented for Ford and General Motors for fiscal year 2001 (In millions). For additional information, their Web sites
Step by Step Solution
There are 3 Steps involved in it
Step: 1

Get Instant Access to Expert-Tailored Solutions
See step-by-step solutions with expert insights and AI powered tools for academic success
Step: 2

Step: 3
Ace Your Homework with AI
Get the answers you need in no time with our AI-driven, step-by-step assistance
Get Started
Continuity Management Audit A Complete Guide
Authors: Gerardus Blokdyk
2019 Edition
0655845860, 978-0655845867