Summary of findings (e.g., how each hypothesis is supported or not)
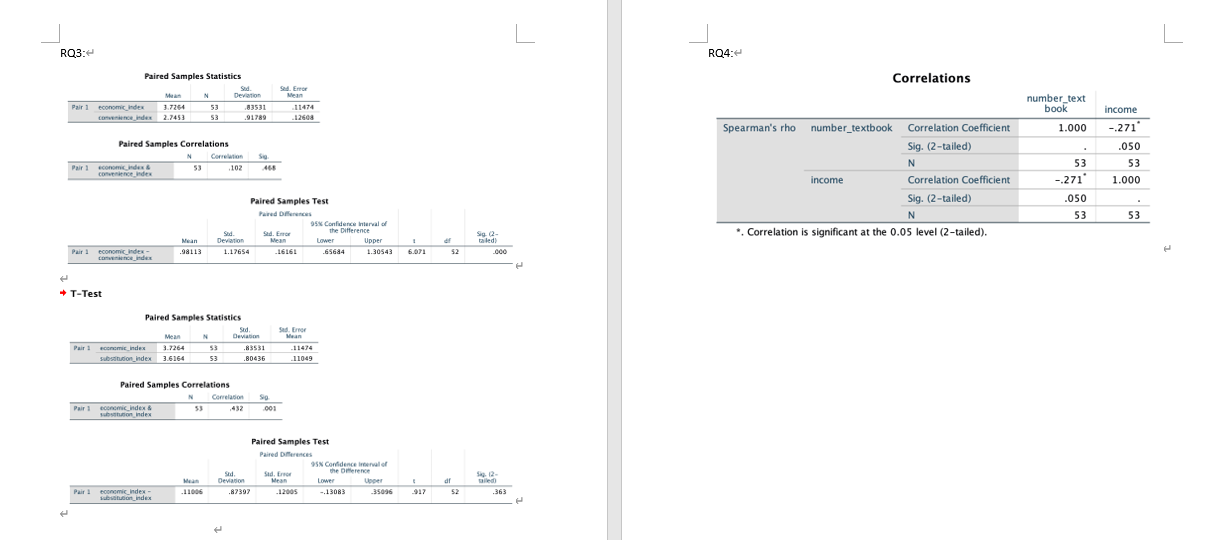
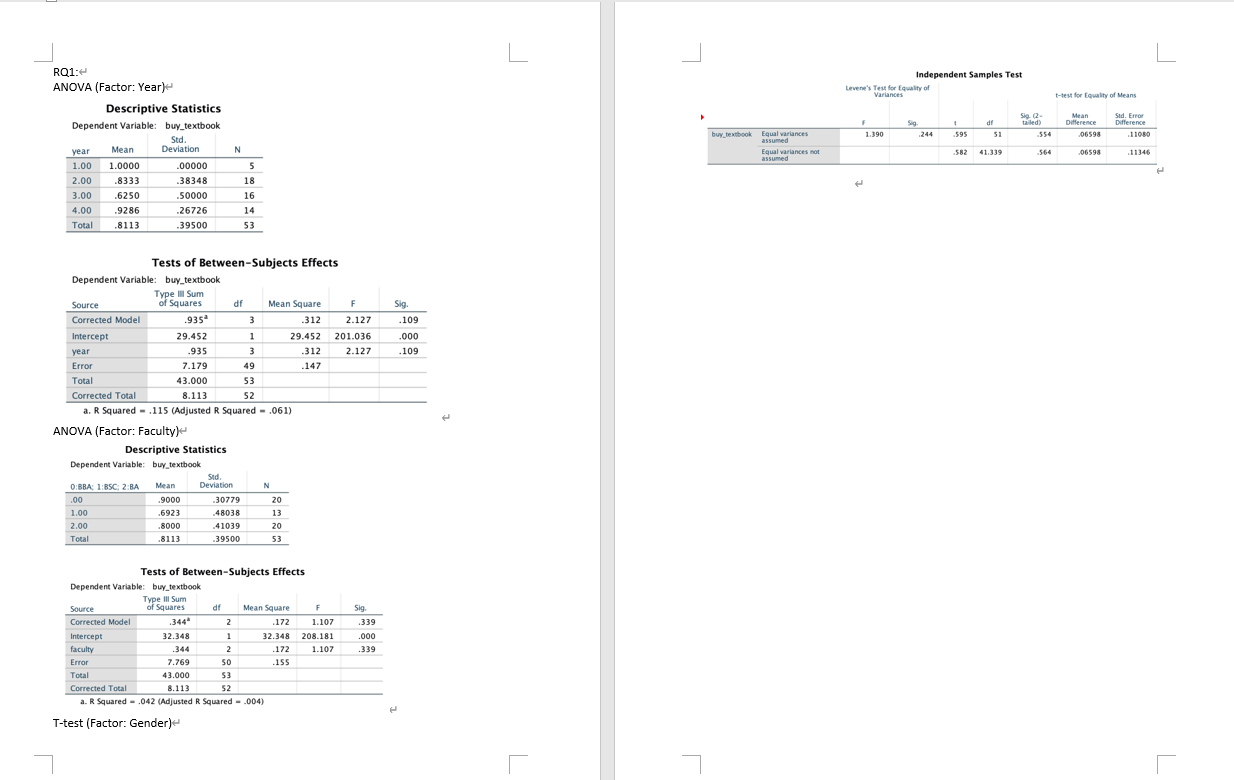
L RQ3:4 RQ4:4 Paired Samples Statistics Correlations Deviation Mean Pair 1 economic_index 3.7254 number_text 53 ,83531 11474 book 2.7453 91789 17604 income Spearman's rho number_textbook Correlation Coefficient 1.000 -.271 Paired Samples Correlations Sig. (2-tailed) 050 Pair 1 economie index & 53 .102 N 53 53 income Correlation Coefficient -.271 1.000 Paired Samples Test Sig. (2-tailed) 050 Paired Differences 53 53 95% Confidence Interval of Sad. the Difference Mean Deviation Sad. Emor Mean Lower Upper ca led *. Correlation is significant at the 0.05 level (2-tailed). Pair 1 economic index - .98113 1.17654 -16161 -65684 1.30543 6.071 + T-Test Paired Samples Statistics Sad. Error Mean Devisoon Mean Pair 1 economic_index 9.7264 53 83531 11474 3.6164 53 80436 11049 Paired Samples Correlations Correlation 90 Pair 1 economic_Index 432 001 Paired Samples Test Paired DiServices $5% Confidence Interval of Sad. And, Error the Dierent Mean 10 12- Deviation Lower Upper Pair ! boonomic_Index - -11006 87397 -12005 .13083 $17 .363RQ1:4 L Independent Samples Test ANOVA (Factor: Year)+ Levent's Test for Equality of Variances t-test for Equality of Means Descriptive Statistics Mean Sad. Error Dependent Variable: buy_textbook difference Difference Std. buy_textbook Equal variances assumed 1.390 .244 .595 554 .06595 11050 year Mean Deviation Equal variances not 582 41.339 564 06598 .11346 1.00 1.0000 00000 assumed 2.00 .8333 38348 18 3.00 .6250 50000 16 4.00 .9286 .26726 14 Total .8113 39500 53 Tests of Between-Subjects Effects Dependent Variable: buy_textbook Type Ill Sum Source of Squares Mean Square Sig. Corrected Model 935 .312 2.127 .109 Intercept 29.452 29.452 201.036 .000 year .935 3 312 2.127 .109 Error 7.179 49 .147 Tota 43.000 53 Corrected Total 8.113 52 a. R Squared - .115 (Adjusted R Squared = .061) ANOVA (Factor: Faculty)+ Descriptive Statistics Dependent Variable: buy_textbook Sad. Q:BBA; 1:85C: 2:BA Mean Deviation .00 .9000 30779 20 1.00 .6923 .48038 13 2.00 8000 41039 20 Total 8113 -39500 53 Tests of Between-Subjects Effects Dependent Variable: buy_textbook Type Ill Sum Source of Squares Mean Square Sig. Corrected Model .344 .172 1.107 .339 Intercept 32.348 32.348 208.181 000 faculty .344 2 .172 1.107 .339 Error 7.769 50 .155 Total 13.000 Corrected Total 8.113 a. R Squared = .042 (Adjusted R Squared = .004) T-test (Factor: Gender)+


