SUMMARY OF KEY RATIOS Notes: Total Revenues = Net Service Revenues + Interest Income Operating Revenues is the same as Net Service Revenues Eamings Before
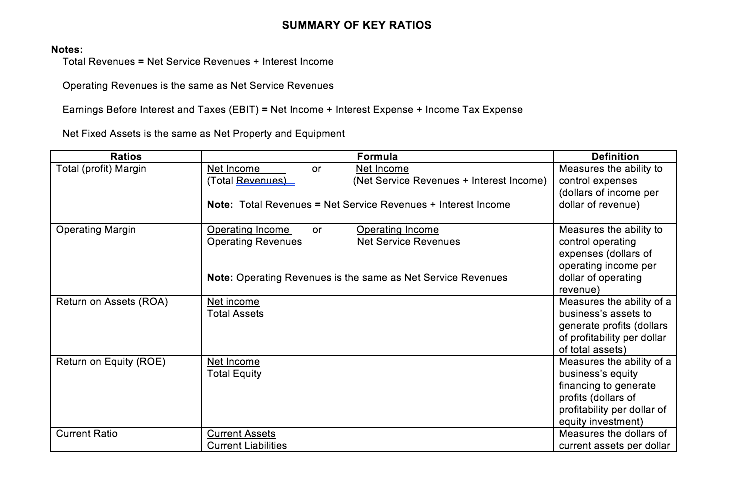
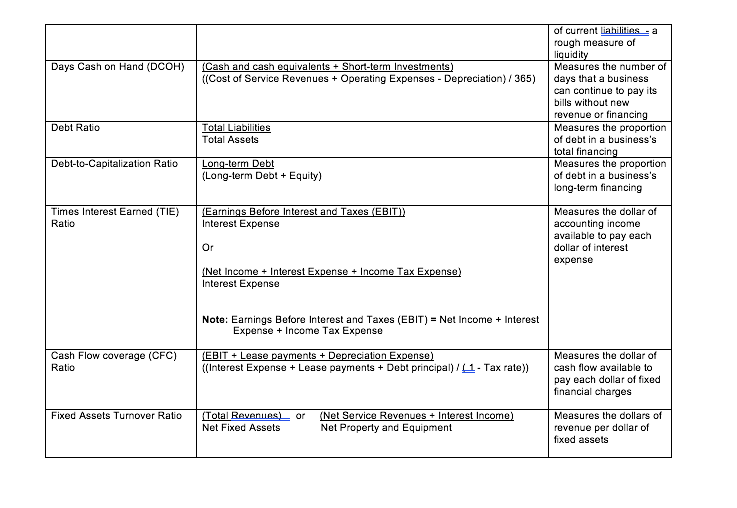
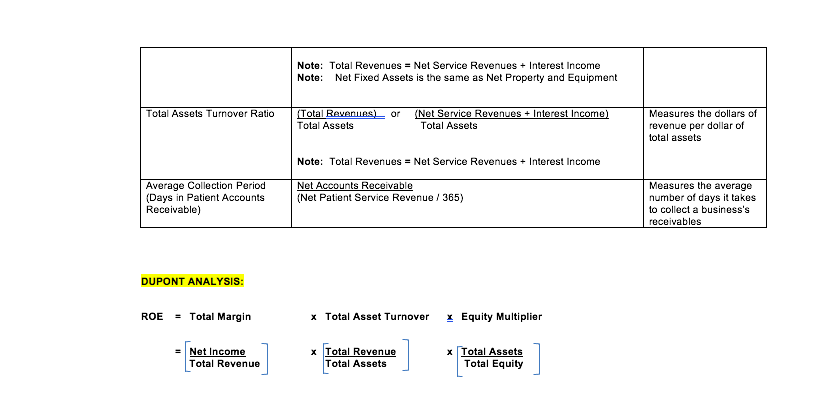
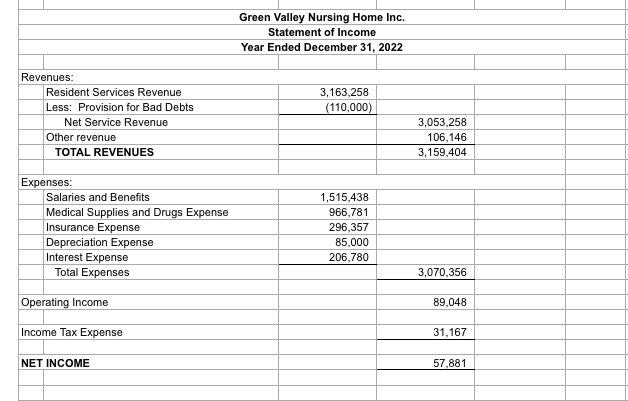
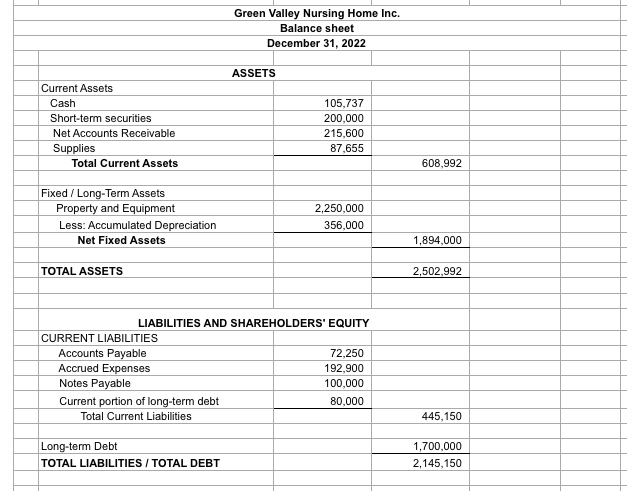
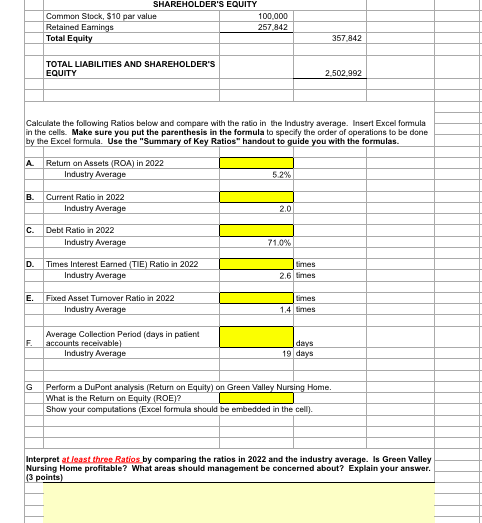
SUMMARY OF KEY RATIOS Notes: Total Revenues = Net Service Revenues + Interest Income Operating Revenues is the same as Net Service Revenues Eamings Before Interest and Taxes (EBIT) = Net Income + Interest Expense + Income Tax Expense Net Fixed Assets is the same as Net Properly and Equipment Ratios Formula Definition Total (profit) Margin Net Income or Net Income Measures the ability to (Total Revenues) (Net Service Revenues + Interest Income) control expenses (dollars of income per Note: Total Revenues = Net Service Revenues + Interest Income dollar of revenue) Operating Margin Operating Income or Operating Income Measures the ability to Operating Revenues Net Service Revenues control operating expenses (dollars of operating income per Note: Operating Revenues is the same as Net Service Revenues dollar of operating revenue Return on Assets (ROA) Net income Measures the ability of a Total Assets business's assets to generate profits (dollars of profitability per dollar of total assets) Return on Equity (ROE) Net Income Measures the ability of a Total Equity business's equity financing to generate profits (dollars of profitability per dollar of equity investment) Current Ratio Current Assets Measures the dollars of Current Liabilities current assets per dollarof current liabilities - a rough measure of liq u id ity Days Cash on Hand (DCOH) (Cash and cash equivalents + Short-term Investments) Measures the number of ([Cost of Service Revenues + Operating Expenses - Depreciation) / 365) days that a business can continue to pay its bills without new revenue or financing Debt Ratio Total Liabilities Measures the proportion Total Assets of debt in a business's total financing Debt-to-Capitalization Ratio Long-term Debt Measures the proportion (Long-term Debt + Equity) of debt in a business's long-term financing Times Interest Eamed (TIE) (Earnings Before Interest and Taxes (EBIT!) Measures the dollar of Ratio Interest Expense accounting income available to pay each Or dollar of interest expense (Net Income + Interest Expense + Income Tax Expense) Interest Expense Note: Earnings Before Interest and Taxes (EBIT) = Net Income + Interest Expense + Income Tax Expense Cash Flow coverage (CFC) (EBIT + Lease payments + Depreciation Expense) Measures the dollar of Ratio ((Interest Expense + Lease payments + Debt principal) / [ 1 - Tax rate)) cash flow available to pay each dollar of fixed financial charges Fixed Assets Turnover Ratio (Total Reverlies)_ or (Net Service Revenues + Interest Income) Measures the dollars of Net Fixed Assets Net Properly and Equipment revenue per dollar of fixed assetsNote: Total Revenues = Net Service Revenues + Interest Income Note: Net Fixed Assets is the same as Net Property and Equipment Total Assets Turnover Ratio (Total Revenues) or (Net Service Revenues + Interest Income) Measures the dollars of Total Assets Total Assets revenue per dollar of total assets Note: Total Revenues = Net Service Revenues + Interest Income Average Collection Period Net Accounts Receivable Measures the average (Days in Patient Accounts (Net Patient Service Revenue / 365) number of days it takes Receivable) to collect a business's receivables DUPONT ANALYSIS: ROE = Total Margin x Total Asset Turnover > Equity Multiplier = Net Income Total Revenue x Total Assets Total Revenue Total Assets Total EquityGreen Valley Nursing Home Inc. Statement of Income Year Ended December 31, 2022 Revenues: Resident Services Revenue 3,163,258 Less: Provision for Bad Debts (110,000) Net Service Revenue 3,053,258 Other revenue 106,146 TOTAL REVENUES 3,159,404 Expenses: Salaries and Benefits 1,515,438 Medical Supplies and Drugs Expense 966,781 Insurance Expense 296,357 Depreciation Expense 85,000 Interest Expense 206,780 Total Expenses 3,070,356 Operating Income 89,048 Income Tax Expense 31,167 NET INCOME 57,881Green Valley Nursing Home Inc. Balance sheet December 31, 2022 ASSETS Current Assets Cash 105,737 Short-term securities 200,000 Net Accounts Receivable 215,600 Supplies 87,655 Total Current Assets 608,992 Fixed / Long-Term Assets Property and Equipment 2,250,000 Less: Accumulated Depreciation 356,000 Net Fixed Assets 1,894,000 TOTAL ASSETS 2,502,992 LIABILITIES AND SHAREHOLDERS' EQUITY CURRENT LIABILITIES Accounts Payable 72,250 Accrued Expenses 192,900 Notes Payable 100,000 Current portion of long-term debt 80,000 Total Current Liabilities 445,150 Long-term Debt 1,700,000 TOTAL LIABILITIES / TOTAL DEBT 2,145,150SHAREHOLDER'S EQUITY Common Stock, $10 par value 100.000 Retained Earnings 257 842 Total Equity 357 842 TOTAL LIABILITIES AND SHAREHOLDER'S EQUITY 2 502 982 Calculate the following Ratios below and compare with the ratio in the Industry average. Insert Excel formula in the cells. Make sure you put the parenthesis in the formula to specify the order of operations to be done by the Excel formula. Use the "Summary of Key Ratios" handout to guide you with the formulas. A Relum on Assets (ROA) in 2022 Industry Average 5.2% B. Current Ratio in 2022 Industry Average 20 C. Debi Ratio in 2022 Industry Average 71.0% D. Times Interest Eamed (TIE) Ratio in 2022 times Industry Average 2.6 times E. Fixed Asset Turnover Ratio in 2022 times Industry Average 1,4 times Average Collection Period (days in patient accounts receivable days Industry Average 19 days G Perform a DuPont analysis (Return on Equity) on Green Valley Nursing Home. What is the Return on Equity (ROE)? Show your computations (Excel formula should be embedded in the cell). Interpret at least three Ratios by comparing the ratios in 2022 and the industry average. Is Green Valley Nursing Home profitable? What areas should management be concerned about? Explain your answer. (points]
Step by Step Solution
There are 3 Steps involved in it
Step: 1
Get Instant Access to Expert-Tailored Solutions
See step-by-step solutions with expert insights and AI powered tools for academic success
Step: 2
Step: 3
Ace Your Homework with AI
Get the answers you need in no time with our AI-driven, step-by-step assistance