

Answered step by step
Verified Expert Solution
Question
1 Approved Answer
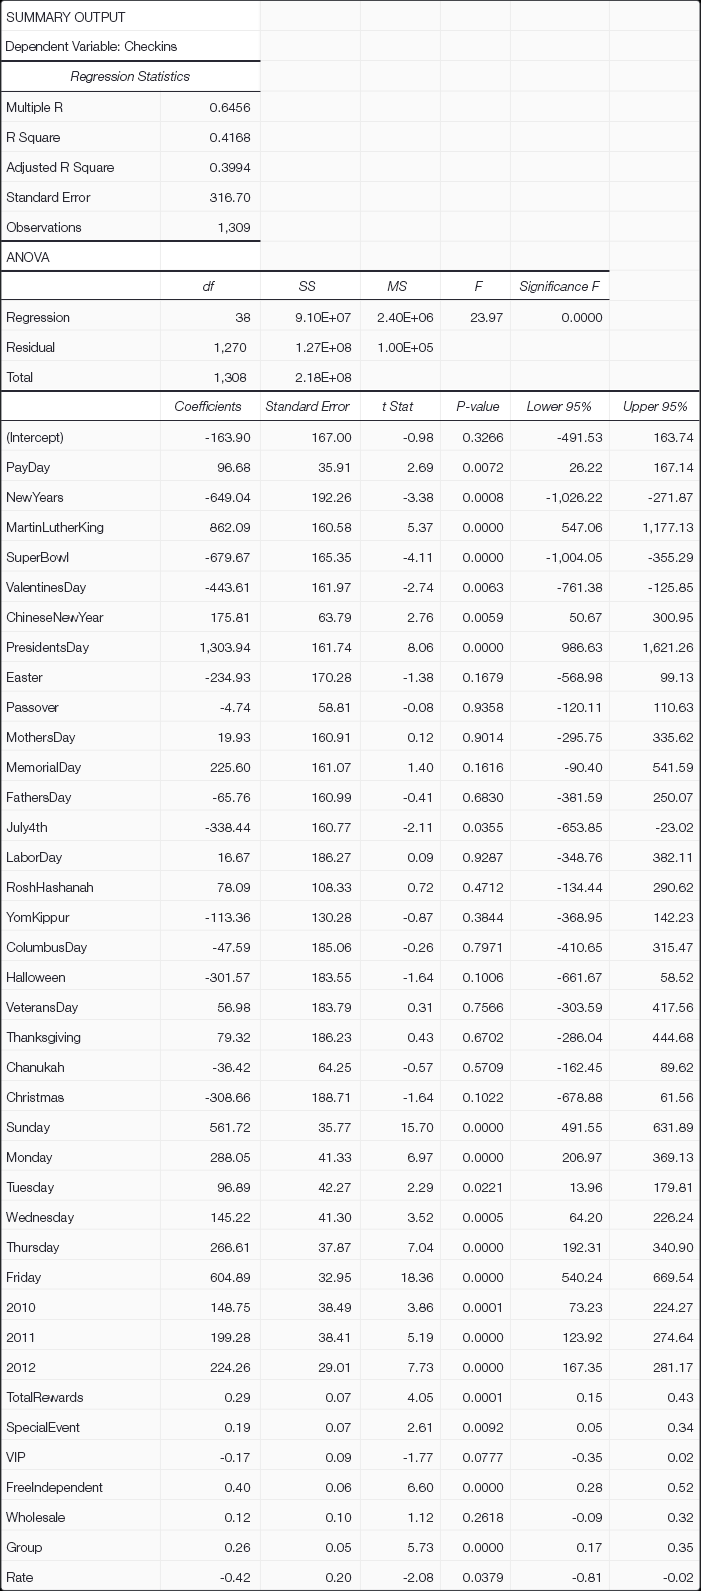
SUMMARY OUTPUT Dependent Variable: Checkins Regression Statistics Multiple R 0.6456 R Square 0.4168 Adjusted R Square 0.3994 Standard Error 316.70 Observations 1,309 ANOVA SS MS
Step by Step Solution
There are 3 Steps involved in it
Step: 1

Get Instant Access to Expert-Tailored Solutions
See step-by-step solutions with expert insights and AI powered tools for academic success
Step: 2

Step: 3
Ace Your Homework with AI
Get the answers you need in no time with our AI-driven, step-by-step assistance
Get Started
Elementary Statisitcs
Authors: Barry Monk
2nd edition
1259345297, 978-0077836351, 77836359, 978-1259295911, 1259295915, 978-1259292484, 1259292487, 978-1259345296