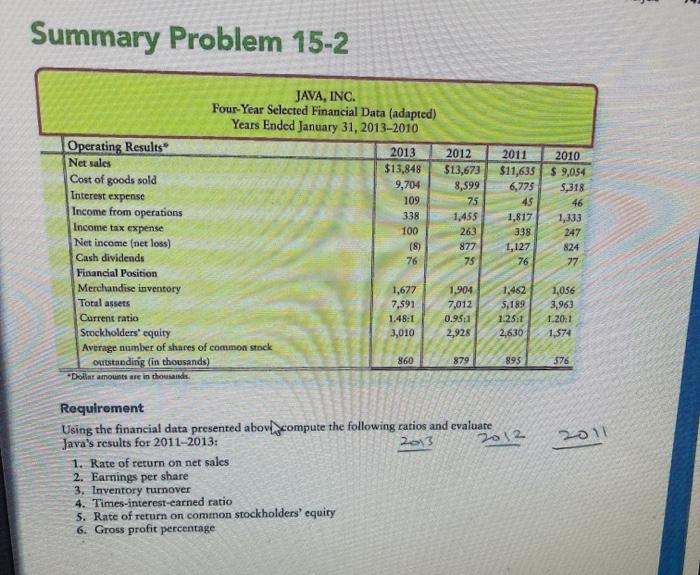
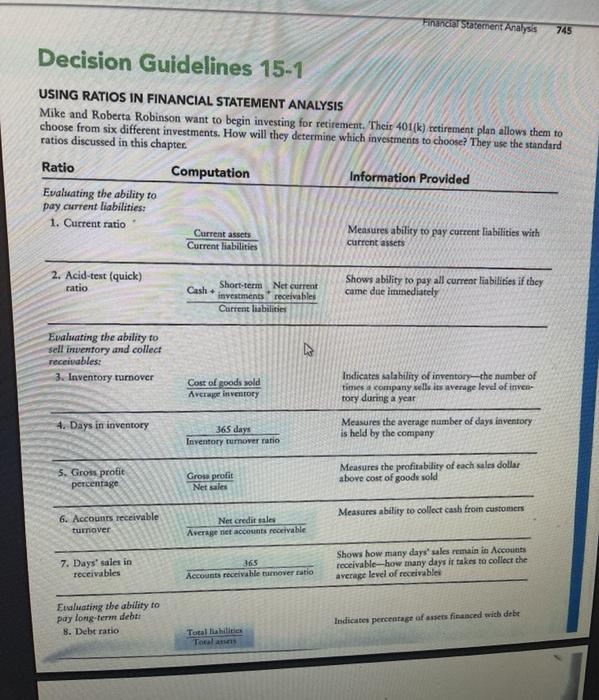
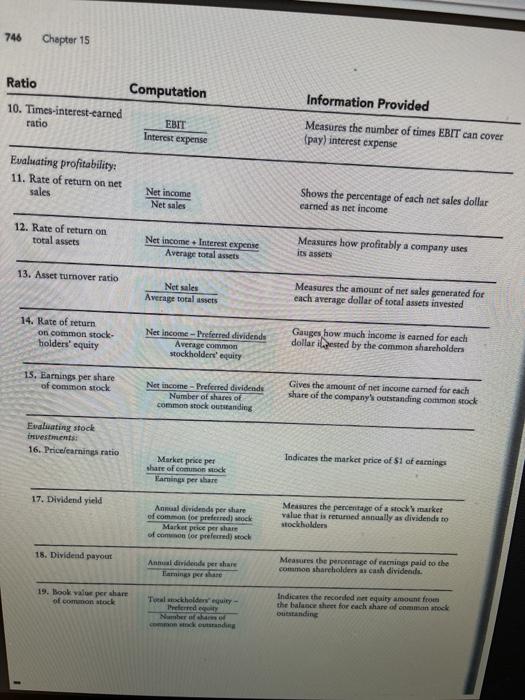
Summary Problem 15-2 JAVA, INC. Four-Year Selected Financial Data (adapted) Years Ended January 31, 2013-2010 Operating Results 2013 Net sales $13,848 Cost of goods sold 9,704 Interest expense 109 Income from operations 338 Income tax expense 100 Net income (net loss) (8) Cash dividends 76 Financial Position Merchandise inventory 1,677 Total assets 7,591 Current ratio 1.48:1 Stockholders' equity 3,010 Average number of shares of common stock 860 outstanding (in thousands) Dollar amounts are in thousands 2012 $13,673 8,599 75 1,455 263 2011 2010 $11,635 $ 9,054 6,775 5,318 45 46 1,817 1,333 338 247 1,127 824 76 77 877 75 1,904 7,012 0.951 2,928 1,462 5,189 1.25:1 2,630 1,056 3,963 1.20:1 1,574 879 895 576 2011 Requirement Using the financial data presented above compute the following ratios and evaluare Java's results for 2011-2013: 2013 2012 1. Rate of return on net sales 2. Earnings per share 3. Inventory turnover 4. Times-interest-earned ratio 5. Rate of return on common stockholders' equity 6. Gross profit percentage Financial Statement Analysis 745 Decision Guidelines 15-1 USING RATIOS IN FINANCIAL STATEMENT ANALYSIS Mike and Roberta Robinson want to begin investing for retirement. Their 401(k) retirement plan allows them to choose from six different investments. How will they determine which investments to choose? They use the standard ratios discussed in this chapter. Ratio Computation Information Provided Evaluating the ability to pay current liabilities: 1. Current ratio Current assets Measures ability to pay current liabilities with Current liabilities current assets 2. Acid-test (quick) ratio Cash Short-term Net current investments receivables Current liabilities Shows ability to pay all current liabilities if they came due immediately Evaluating the ability to sell inventory and collect receivables: 3. Inventory turnover Cost of goods sold Average Inventory Indicates salability of inventory the number of times a company sells i average level of inven tory during a year 4. Days in inventory 365 days Inventory turnover ratio Measures the average number of days inventory is held by the company 5. Gross profit percentage Grow profit Net sales Measures the profitability of each sales dollar above cost of goods sold Measures ability to collect cash from customers 6. Accounts receivable turnover Net credit sales Average net accounts receivable 7. Days' sales in receivables 365 Accounts receivable rumover ratio Shows how many days' sales remain in Accounts receivable-how many days it takes to collect the average level of receivable Evaluating the ability to pay long-term deber 8. Debe ratio Indicates percentage of assets financed with debe Total liabilities Tocal as 746 Chapter 15 Ratio Computation Information Provided 10. Times-interest-earned ratio EBIT Interest expense Measures the number of times EBIT can cover (pay) interest expense Evaluating profitability: 11. Rate of return on net sales Net income Net sales Shows the percentage of each net sales dollar carned as net income 12. Rate of return on total assets Net income Interest expense Average total assets Measures how profitably a company uses its assets 13. Asset tumover ratio Net sales Average total assets Measures the amount of net sales generated for each average dollar of total assets invested 14. Rate of return on common stock bolders' equity Net Income - Preferred dividende Average como stockholders' equity Gauges how much income is earned for each dollar ested by the common shareholders 15. Eamnings per share of common stock Ner income-Preferred dividende Number of shares of common stock outstanding Gives the amount of net income camed for each share of the company outstanding common stock Evaluating stock investments 16. Pricelearnings ratio Indicates the market price of $1 of earning Market peice per share of common stock Haming per share 17. Dividend yield Annaduvidende per share of common for preferred) Mock Market price per share of common for preferred stock Mensures the percentage of a stock market value that is returned annually as dividende to stockholders 15. Dividend payout Anhua dividende per share Taming pa Measures the percentage of aming paid to the common shareholders as cash dividende 19. look valor per share of common stock Tockholders' equity- Indicate the recorded met equity amount from the balance sheet for each share of common stock Outstanding Number Command and