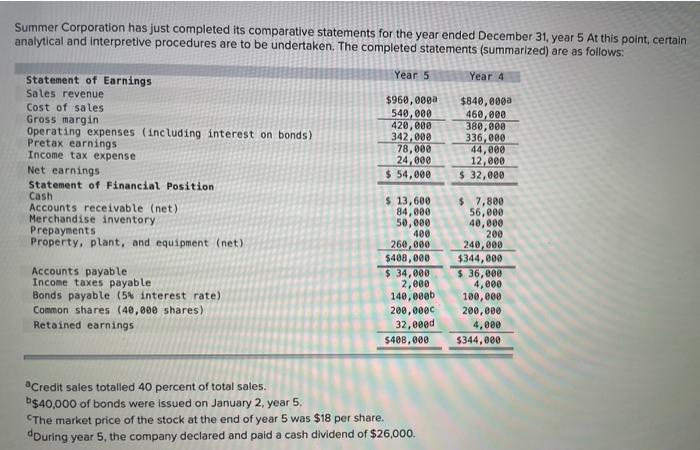
Summer Corporation has just completed its comparative statements for the year ended December 31, year 5 At this point, certain analytical and interpretive procedures are to be undertaken. The completed statements (summarized) are as follows: Year 5 Year 4 Statement of Earnings Sales revenue Cost of sales Gross margin Operating expenses (including interest on bonds) Pretax earnings Income tax expense Net earnings Statement of Financial Position Cash Accounts receivable (net) Merchandise inventory Prepayments Property, plant, and equipment (net) $960,000 540,000 420,000 342,000 78,000 24,000 $ 54,000 $840,0000 460,000 380,000 336,000 44,000 12,000 $ 32,000 Accounts payable Income taxes payable Bonds payable (54 interest rate) Common shares (40,000 shares) Retained earnings $ 13,600 84,000 50,000 400 260,000 $408,000 $ 34,000 2,000 140,000 200,000 32,eeed $400,000 $ 7,800 56,000 40,000 200 240,000 $344,000 $ 36,000 4,000 100,000 200,000 4,000 $344,000 Credit sales totalled 40 percent of total sales. b$40,000 of bonds were issued on January 2, year 5. The market price of the stock at the end of year 5 was $18 per share. douring year 5, the company declared and paid a cash dividend of $26,000. Required: 1. Compute appropriate ratios for year 5. (Use "365" days a year. Round "Tax rate" to the nearest whole percentage. Round intermediate calculations and other answers to 2 decimal places. Round percentage answers to 1 decimal place.) *** per share % Name and Computation of the 2018 Ratio Profitability ratios: Return on equity Return on assets Financial leverage percentage Earnings per share Profit margin Fixed asset turnover Liquidity ratios: Cash ratio Current ratio Quick ratio Assef turnover ratios: Receivables turnover Average days to collect receivables Inventory turnover Average days to sell inventory Solvency ratios Times interest earned Debt-to-equity ratio Market ratios: Pricelearnings ratio Dividend yield ratio times days times days times %