Answered step by step
Verified Expert Solution
Question
1 Approved Answer
Sun Products Company Sun Products Company (SPC) makes a range of components for various customers in the automotive industry at home and abroad. One of


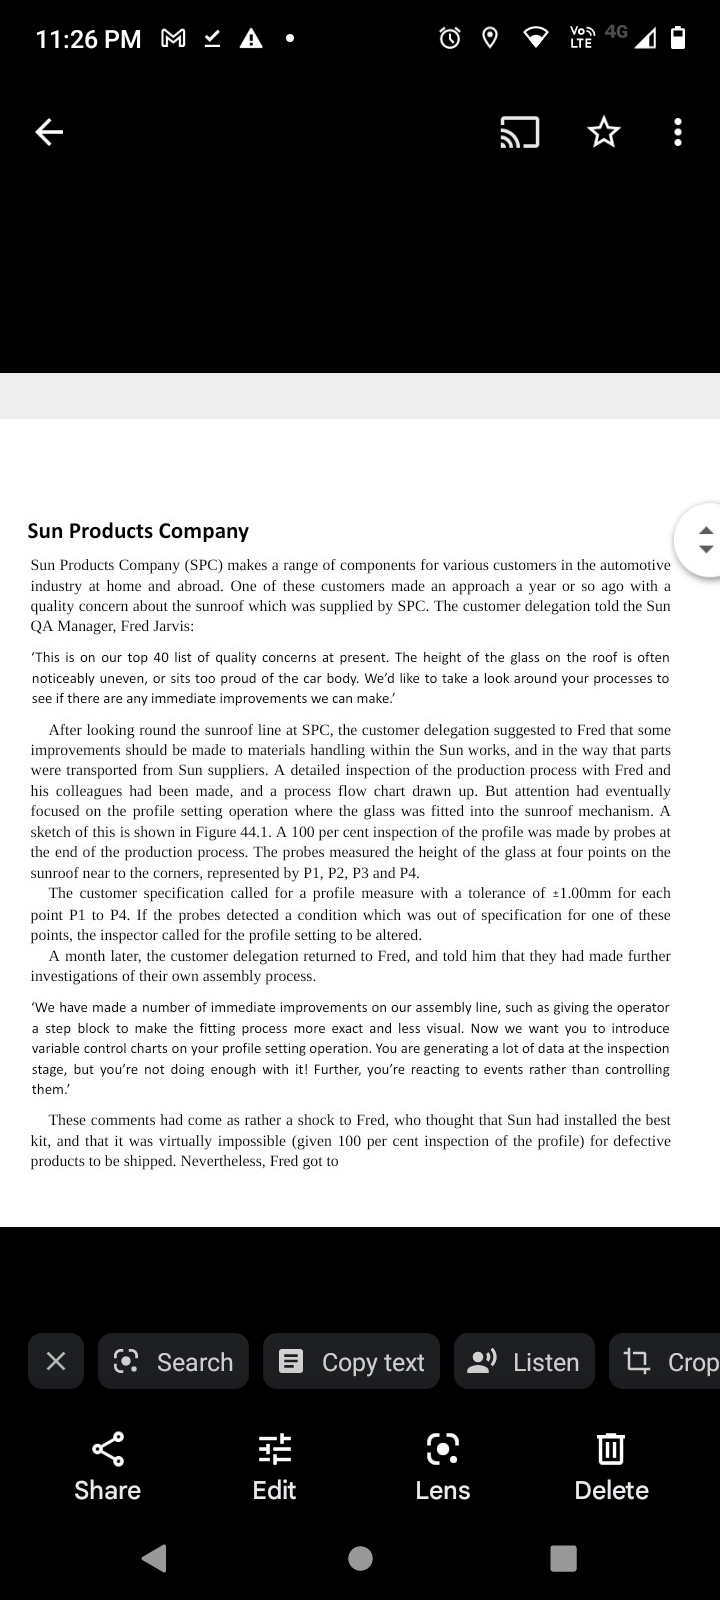
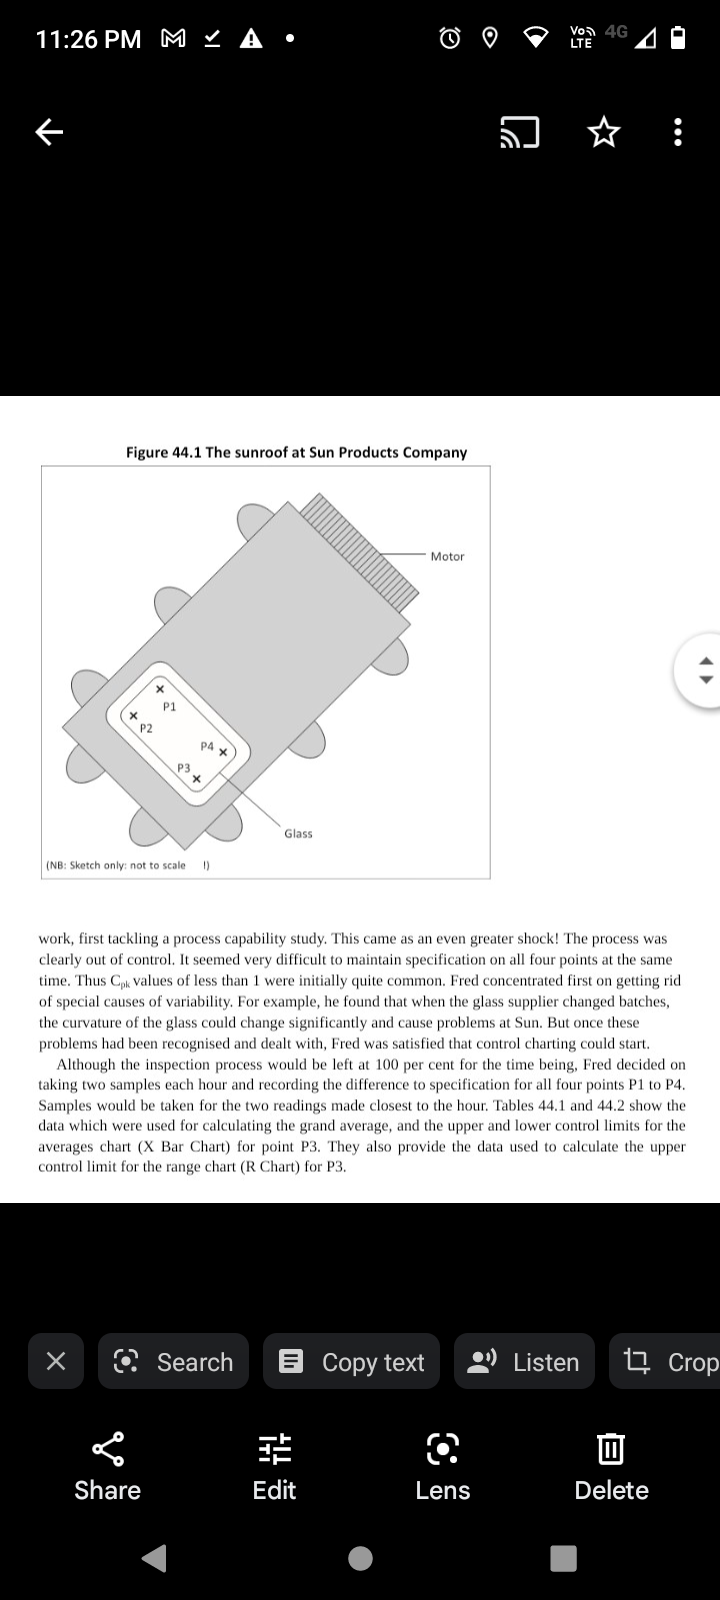
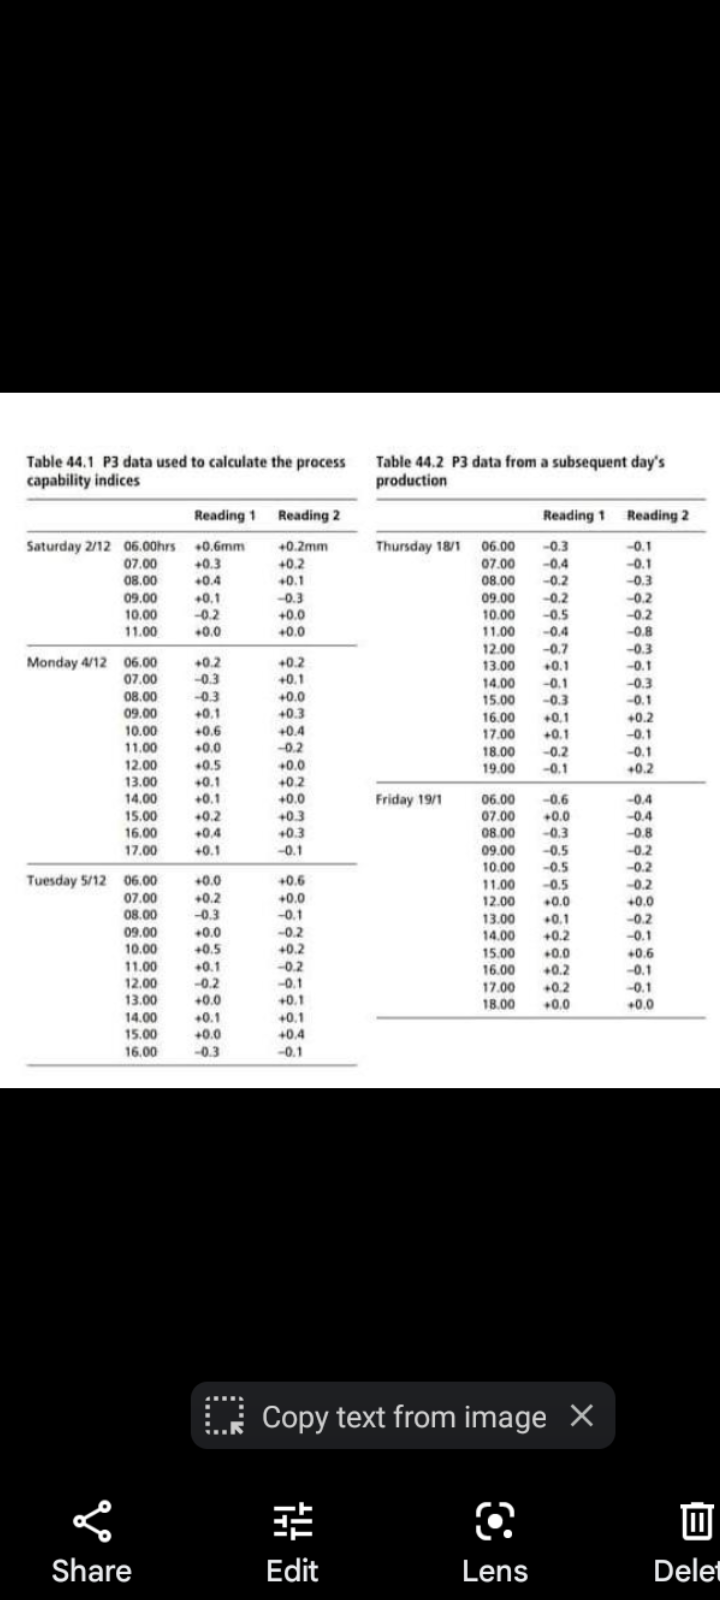
 Sun Products Company Sun Products Company (SPC) makes a range of components for various customers in the automotive industry at home and abroad. One of these customers made an approach a year or so ago with a quality concern about the sunroof which was supplied by SPC. The customer delegation told the Sun QA Manager, Fred Jarvis: 'This is on our top 40 list of quality concerns at present. The height of the glass on the roof is often noticeably uneven, or sits too proud of the car body. We'd like to take a look around your processes to see if there are any immediate improvements we can make.' After looking round the sunroof line at SPC, the customer delegation suggested to Fred that some improvements should be made to materials handling within the Sun works, and in the way that parts were transported from Sun suppliers. A detailed inspection of the production process with Fred and his colleagues had been made, and a process flow chart drawn up. But attention had eventually focused on the profile setting operation where the glass was fitted into the sunroof mechanism. A sketch of this is shown in Figure 44.1. A 100 per cent inspection of the profile was made by probes at the end of the production process. The probes measured the height of the glass at four points on the sunroof near to the corners, represented by P1, P2, P3 and P4. The customer specification called for a profile measure with a tolerance of 1.00mm for each point P1 to P4. If the probes detected a condition which was out of specification for one of these points, the inspector called for the profile setting to be altered. A month later, the customer delegation returned to Fred, and told him that they had made further investigations of their own assembly process. 'We have made a number of immediate improvements on our assembly line, such as giving the operator a step block to make the fitting process more exact and less visual. Now we want you to introduce variable control charts on your profile setting operation. You are generating a lot of data at the inspection stage, but you're not doing enough with it! Further, you're reacting to events rather than controlling them.' These comments had come as rather a shock to Fred, who thought that Sun had installed the best kit, and that it was virtually impossible (given 100 per cent inspection of the profile) for defective products to be shipped. Nevertheless, Fred got to Figure 44.1 The sunroof at Sun Products Company work, first tackling a process capability study. This came as an even greater shock! The process was clearly out of control. It seemed very difficult to maintain specification on all four points at the same time. Thus Ck values of less than 1 were initially quite common. Fred concentrated first on getting rid of special causes of variability. For example, he found that when the glass supplier changed batches, the curvature of the glass could change significantly and cause problems at Sun. But once these problems had been recognised and dealt with, Fred was satisfied that control charting could start. Although the inspection process would be left at 100 per cent for the time being, Fred decided on taking two samples each hour and recording the difference to specification for all four points P1 to P4. Samples would be taken for the two readings made closest to the hour. Tables 44.1 and 44.2 show the data which were used for calculating the grand average, and the upper and lower control limits for the averages chart ( X Bar Chart) for point P3. They also provide the data used to calculate the upper control limit for the range chart (R Chart) for P3. Table 44.1 P3 data used to calculate the process Table 44.2P3 data from a subsequent day's production 4 Table 44.2 shows data for P3 that was collected on a subsequent day. Again, - plot the data on the X and R chart. Comment on the degree of process control this indicates. 5 The customer is now pressing for the engineering tolerances to be reduced to 0.5mm. What effect would this have on process capability at Sun? 6 Comment on the sequence of events leading up to the introduction of control charting for the sunroof at Sun Products
 Step by Step Solution
There are 3 Steps involved in it
Step: 1

Get Instant Access to Expert-Tailored Solutions
See step-by-step solutions with expert insights and AI powered tools for academic success
Step: 2

Step: 3

Ace Your Homework with AI
Get the answers you need in no time with our AI-driven, step-by-step assistance
Get Started


