Answered step by step
Verified Expert Solution
Link Copied!

Question

1 Approved Answer

Supermarket customers load their carts with goods totaling between $5 and $250 uniformly (and continuously) distributed; call this the raw order amount. Assume that customers

Supermarket customers load their carts with goods totaling between $5 and $250 uniformly (and continuously) distributed; call this the raw order amount. Assume that customers purchase independently of each other. At checkout, 63% of customers have a loyalty card that gives them 4% off their raw order amount. Also at checkout, 18% of customers have coupons that give them 7% off their raw order amount. These two discounts occur independently of each other, and a given customer could have one or the other of them, both of them, or neither of them. To get to their net order amount (what they actually pay) construct a spreadsheet simulation to simulate 100 customers and collect statistics on the net order amount; these statistics should include the average, standard deviation, minimum, maximum, and a histogram to describe the distribution of the net order amounts between $0 and $250. To make the requested histogram, you can either mimic what was done in the newsvendor spreadsheet simulation, or use a different approach via whatever built-in Excel facilities you'd like. (HINT: To decide whether a customer gets a loyalty discount, explore the Excel IF function with the first argument's being a random number RAND() distributed uniformly between 0 and 1; do similarly to decide on a coupon discount.)image text in transcribed

Newsvendor Problem 30 Days - 100 - 120 = 140 = 160 = 180 INPUT DATA Wholesale price c $0.55 Day Demand Sold Scrap Profit Sold Scrap Profit Sold Scrap Profit Sold Scrap Profit Sold Scra 7 56.21133 27 45.81 133 47 35.41 $1.00|| 2 145|100 0 45.00|120 0 54.00|140 063.00|145 155745|145 354706 Scrap price s = $0.0313 181|100 045.00|120 054.00|140 063.00|160 072.00| 180 081.00 Demand parameter = 135.701 14 106| 100 0 45.00| 106 144042| 106 3430.02| 106 54 19.62| 106 749.22 Demand parameter = 27,10115 128 100 0 45.00 120 0 54.001 128 1251.36 128 3240.9 128 5230.56 0 54.00 12218 45.5412238 35.1412258 24.74 7 142 100 0 45.00 1200 54.00 140 0 63.00 142 18 54.5414238 44.14 8 16910045.001200 54.00 1400 63.00 160 0 72.00169 11 70.33 0 54.00 12020 43.60 120 40 33.20 12060 22.80 10 111| 100 0 45.001111 94527 111 2934.8 111 4924.4 111 691407 11157 100 0 45.00 1200 54.00140 0 63.003 69.0915723 58.69 12 1101 100 0 45.001 110 10 44.3 110 30 3390| 110 50 23.5 110 70 13.10 13 131 100 0 45.00|120 0 54.001 131 95427|131 2943.8 131 493347 14130 100 0 45.00 1200 54.00 30 10 53.30 130 30 42.9013050 32.50 15 162 100 045.00 1200 54.00 140 0 63.0000 72.00118 63.54 16 17 1000 45.00120 054.00 137 3 60.0913723 49.691743 39.29 17 138 100045.00 120 0 54.00138 2 61.06 122 50.66142 40.26 18 230 100 0 45.00 1200 54.0000 63.00 160 0 72.0080081.00 19123 100 0 45.00 1200 54.0012317 46.51 12337 36.12357 25.71 20135 1000 45.00 120 0 54.00 135 5 58.15135 25 47.7513545 37.35 100045.00 120 0 54.0 1400 63.00557.45 145 35 47.05 22135 100045.00 120 054.0 35 58.15 13525 47.75135 45 37.35 23175 100045.00 120 054.0 400 63.000 72.00175 5 76.15 241331000 4.00 200 54.00133 7 56.21133 27 45.81 13347 35.41 152 8 64.24 28 53.84 261 0 4500 200 54.001355 58.15135 25 47.75135 45 37.35 27137 100 0 45.00 20054.0073 60.09 137 23 49.69137 43 39.29 5 58.15 135 25 47.75 135 45 37.35 29 1101 100 04500| 110 10 44.30| 110 30 3390| 110 5023.5 110 7013.10 0 72.00773 78.09 E(Profit/Day) 45.00 E(Profit/Day) 52.61 E(Profit/Day) 54.88 E(Profit/Day) 49.69 E(Profit/Day) 41.97 133 100 045.00 120 0 54.00137 Retail price r - 122 100 0 45.00120 120100 0 45.00 120 60 50 20 80 100 120 140 160 180 200 q (papers) 25 152 100 0 45.00 20054.00 400 63.0 135 100 135 100 177 100 0 45.00 120 0 54.00 135 0 54.00 140 1.37 30 0 45.00 120 0 63.00 160 3.84 Prob(Loss) 0.00Prob(Loss) 0.00 Prob(Loss) 0.00 Prob(Loss) 0.00 Prob(Loss) 0.00 Cum. Fre Cum. Freq Cum. Freq in loOpS Cum. Fre Cum. Fre 18 14 30 30 30 30 30 16 12 30 14 2215 30 30 28 100

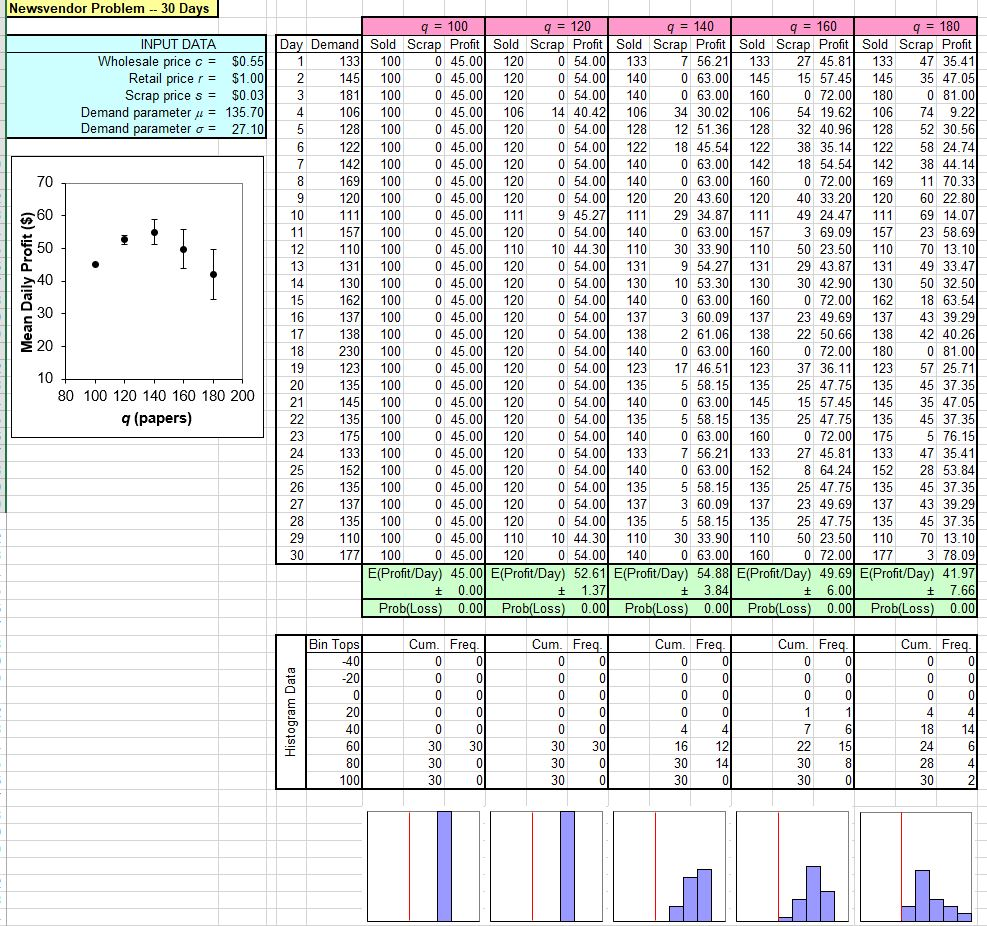
Step by Step Solution

There are 3 Steps involved in it

Step: 1

blur-text-image

Get Instant Access to Expert-Tailored Solutions

See step-by-step solutions with expert insights and AI powered tools for academic success

Step: 2

blur-text-image

Step: 3

blur-text-image

Ace Your Homework with AI

Get the answers you need in no time with our AI-driven, step-by-step assistance

Get Started

Recommended Textbook for

Machine Learning And Knowledge Discovery In Databases European Conference Ecml Pkdd 2014 Nancy France September 15 19 2014 Proceedings Part 2 Lnai 8725

Authors: Toon Calders ,Floriana Esposito ,Eyke Hullermeier ,Rosa Meo

2014th Edition

3662448505, 978-3662448502

More Books

Students also viewed these Databases questions

Question

manageremployee relationship deteriorating over time;

Answered: 1 week ago