SUPPORTING INFORMATION
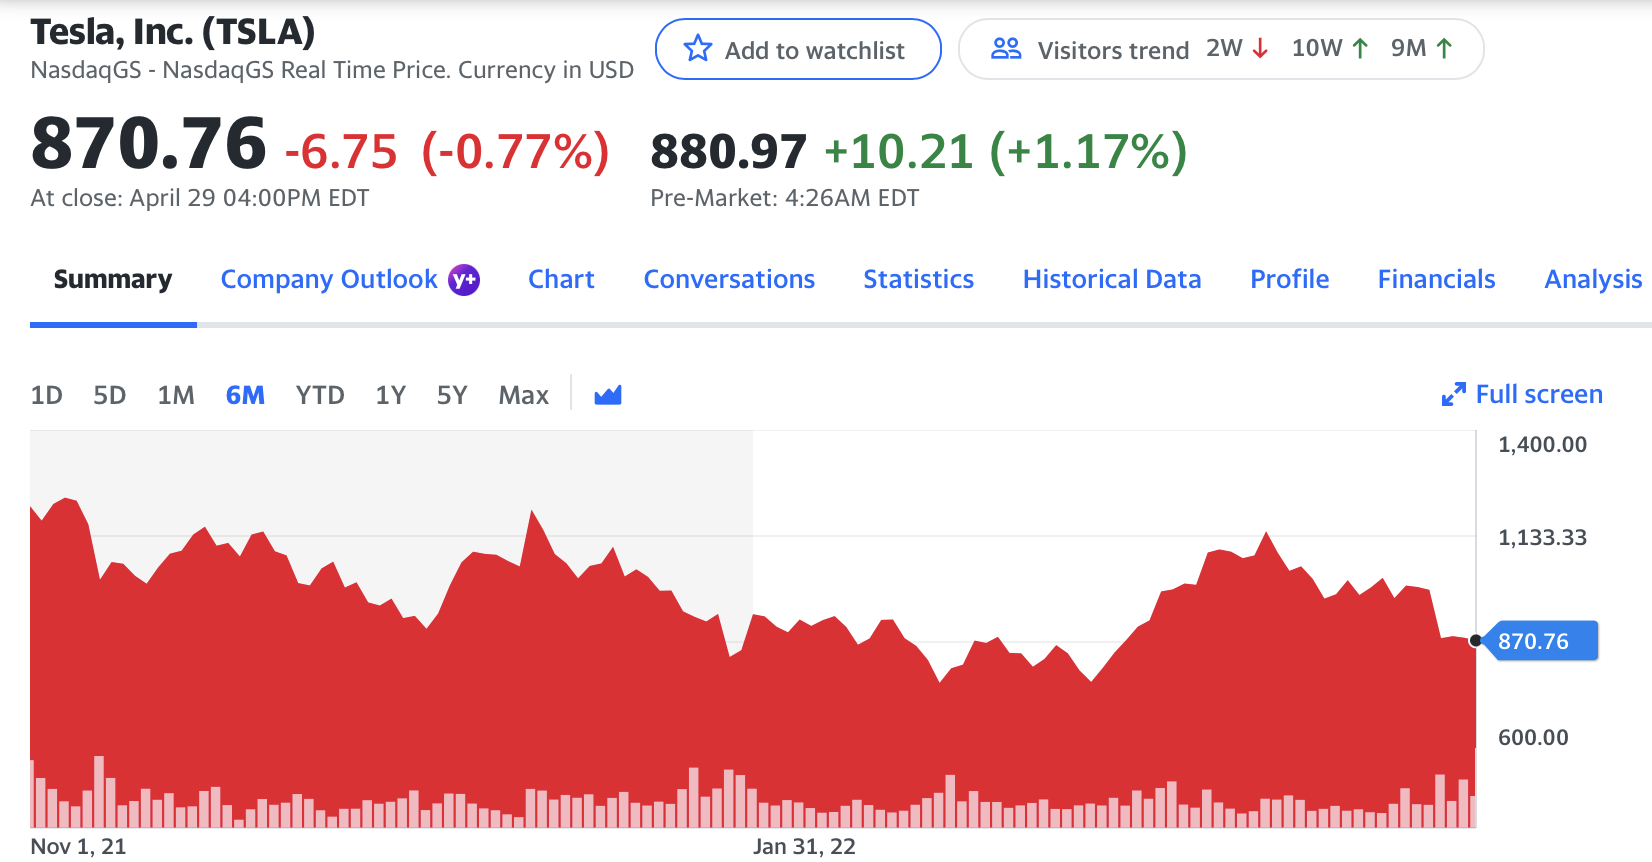
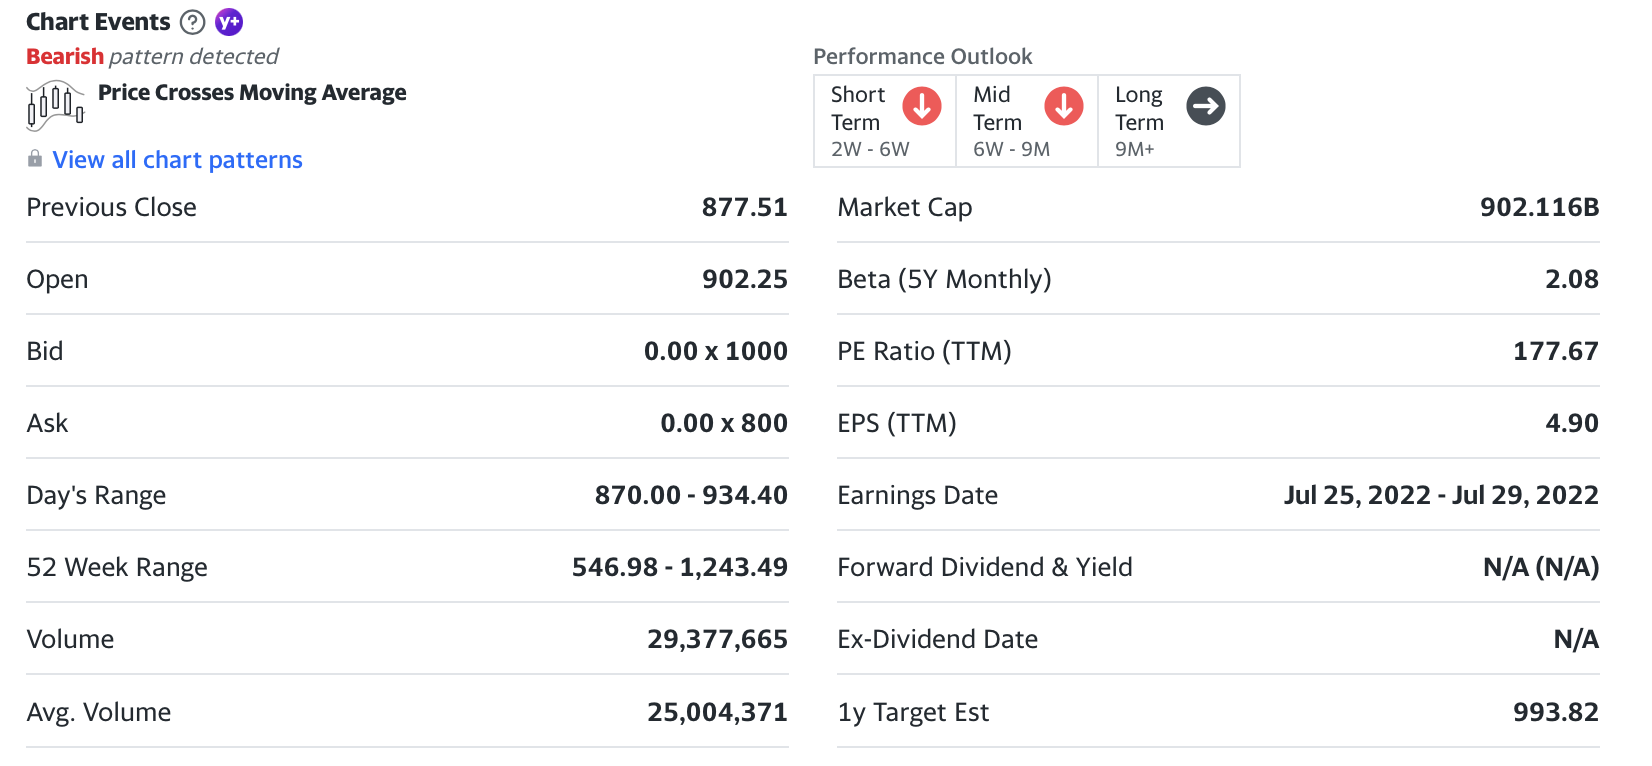
Stock ticker TSLA (TESLA)


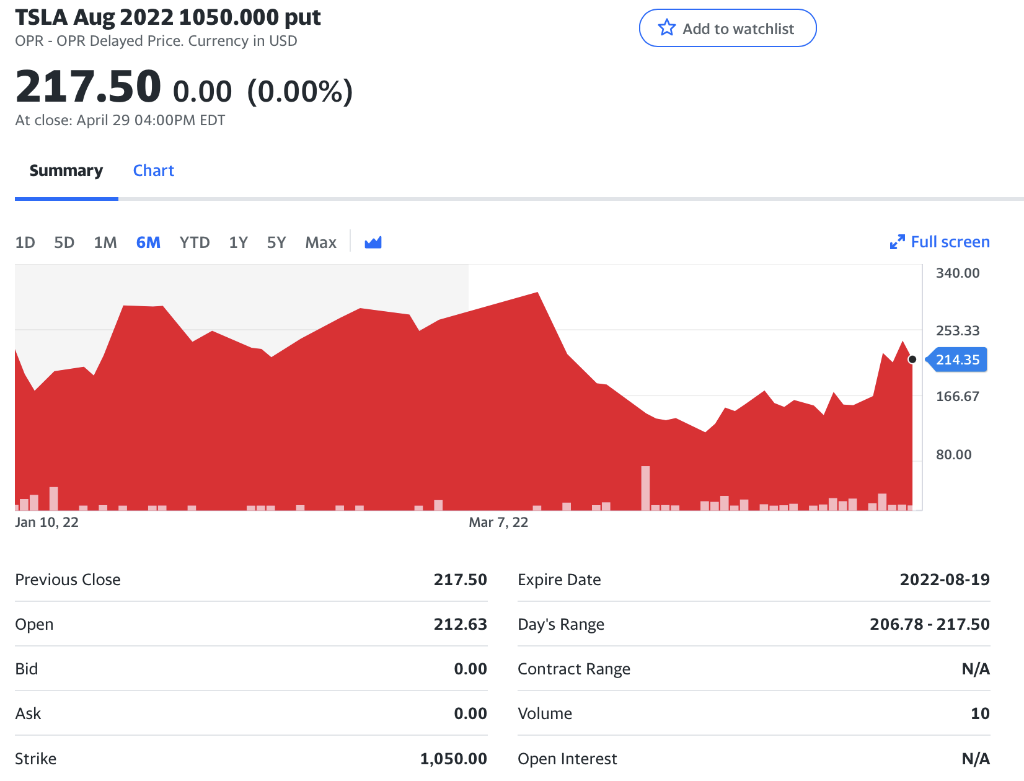
TSLA 3 Months Put Option contract: TSLA220819P01050000

Use the stock index you're following at the money and use volatility. Use the appropriate risk-free rate. Create a three-step binomial tree to value a six-month put option on the index. With the strike price at the money, if it's: A. European B. America Tesla, Inc. (TSLA) Add to watchlist NasdaqGS - Nasdaq GS Real Time Price. Currency in USD 870.76-6.75 (-0.77%) 880.97 +10.21 (+1.17%) At close: April 29 04:00PM EDT Pre-Market: 4:26AM EDT Summary Company Outlook y+ Chart Conversations Statistics Historical Data 1D 5D 1M 6M YTD 1Y 5Y Max Nov 1, 21 Jan 31, 22 Visitors trend 2W 10W 9M Profile Financials Analysis Full screen 1,400.00 1,133.33 870.76 600.00 Chart Events y+ Bearish pattern detected 60000 Price Crosses Moving Average View all chart patterns Previous Close Open Bid Ask Day's Range 52 Week Range Volume Avg. Volume 877.51 902.25 0.00 x 1000 0.00 x 800 870.00-934.40 546.98 1,243.49 29,377,665 25,004,371 Performance Outlook Mid Short Term Term 2W - 6W 6W - 9M Market Cap Beta (5Y Monthly) PE Ratio (TTM) EPS (TTM) Earnings Date Forward Dividend & Yield Ex-Dividend Date 1y Target Est Long Term 9M+ 902.116B 2.08 177.67 4.90 Jul 25, 2022 - Jul 29, 2022 N/A (N/A) N/A 993.82 TSLA Aug 2022 1050.000 put OPR-OPR Delayed Price. Currency in USD 217.50 0.00 (0.00%) At close: April 29 04:00PM EDT Summary Chart 1D 5D 1M 6M YTD 1Y 5Y Max Jan 10, 22 Previous Close Open Bid Ask Strike Mar 7, 22 217.50 212.63 0.00 0.00 1,050.00 Expire Date Day's Range Contract Range Volume Open Interest Add to watchlist Full screen 340.00 253.33 214.35 166.67 80.00 2022-08-19 206.78 217.50 N/A 10 N/A Use the stock index you're following at the money and use volatility. Use the appropriate risk-free rate. Create a three-step binomial tree to value a six-month put option on the index. With the strike price at the money, if it's: A. European B. America Tesla, Inc. (TSLA) Add to watchlist NasdaqGS - Nasdaq GS Real Time Price. Currency in USD 870.76-6.75 (-0.77%) 880.97 +10.21 (+1.17%) At close: April 29 04:00PM EDT Pre-Market: 4:26AM EDT Summary Company Outlook y+ Chart Conversations Statistics Historical Data 1D 5D 1M 6M YTD 1Y 5Y Max Nov 1, 21 Jan 31, 22 Visitors trend 2W 10W 9M Profile Financials Analysis Full screen 1,400.00 1,133.33 870.76 600.00 Chart Events y+ Bearish pattern detected 60000 Price Crosses Moving Average View all chart patterns Previous Close Open Bid Ask Day's Range 52 Week Range Volume Avg. Volume 877.51 902.25 0.00 x 1000 0.00 x 800 870.00-934.40 546.98 1,243.49 29,377,665 25,004,371 Performance Outlook Mid Short Term Term 2W - 6W 6W - 9M Market Cap Beta (5Y Monthly) PE Ratio (TTM) EPS (TTM) Earnings Date Forward Dividend & Yield Ex-Dividend Date 1y Target Est Long Term 9M+ 902.116B 2.08 177.67 4.90 Jul 25, 2022 - Jul 29, 2022 N/A (N/A) N/A 993.82 TSLA Aug 2022 1050.000 put OPR-OPR Delayed Price. Currency in USD 217.50 0.00 (0.00%) At close: April 29 04:00PM EDT Summary Chart 1D 5D 1M 6M YTD 1Y 5Y Max Jan 10, 22 Previous Close Open Bid Ask Strike Mar 7, 22 217.50 212.63 0.00 0.00 1,050.00 Expire Date Day's Range Contract Range Volume Open Interest Add to watchlist Full screen 340.00 253.33 214.35 166.67 80.00 2022-08-19 206.78 217.50 N/A 10 N/A


