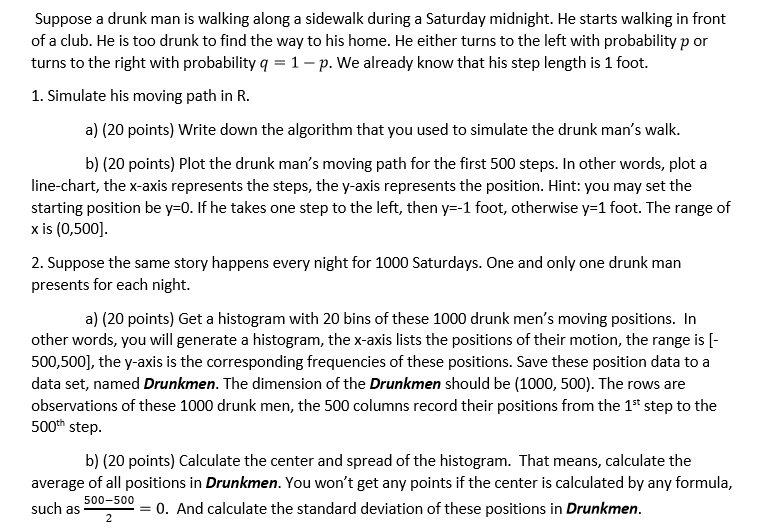
Suppose a drunk man is walking along a sidewalk during a Saturday midnight. He starts walking in front of a club. He is too drunk to find the way to his home. He either turns to the left with probability p or turns to the right with probability q -1-p. We already know that his step length is 1 foot. 1. Simulate his moving path in R. a) (20 points) Write down the algorithm that you used to simulate the drunk man's walk. b) (20 points) Plot the drunk man's moving path for the first 500 steps. In other words, plot a line-chart, the x-axis represents the steps, the y-axis represents the position. Hint: you may set the starting position be y-0. If he takes one step to the left, then y--1 foot, otherwise y-1 foot. The range of x is (0,500] 2. Suppose the same story happens every night for 1000 Saturdays. One and only one drunk man presents for each night. a) (20 points) Get a histogram with 20 bins of these 1000 drunk men's moving positions. In other words, you will generate a histogram, the x-axis lists the positions of their motion, the range is [- 500,500], the y-axis is the corresponding frequencies of these positions. Save these position data to a data set, named Drunkmen. The dimension of the Drunkmen should be (1000, 500). The rows are observations of these 1000 drunk men, the 500 columns record their positions from the 1st step to the 500th step b) (20 points) Calculate the center and spread of the histogram. That means, calculate the average of all positions in Drunkmen. You won't get any points if the center is calculated by any formula, such as 500-500 -= 0. And calculate the standard deviation of these positions in Drunkmen Suppose a drunk man is walking along a sidewalk during a Saturday midnight. He starts walking in front of a club. He is too drunk to find the way to his home. He either turns to the left with probability p or turns to the right with probability q -1-p. We already know that his step length is 1 foot. 1. Simulate his moving path in R. a) (20 points) Write down the algorithm that you used to simulate the drunk man's walk. b) (20 points) Plot the drunk man's moving path for the first 500 steps. In other words, plot a line-chart, the x-axis represents the steps, the y-axis represents the position. Hint: you may set the starting position be y-0. If he takes one step to the left, then y--1 foot, otherwise y-1 foot. The range of x is (0,500] 2. Suppose the same story happens every night for 1000 Saturdays. One and only one drunk man presents for each night. a) (20 points) Get a histogram with 20 bins of these 1000 drunk men's moving positions. In other words, you will generate a histogram, the x-axis lists the positions of their motion, the range is [- 500,500], the y-axis is the corresponding frequencies of these positions. Save these position data to a data set, named Drunkmen. The dimension of the Drunkmen should be (1000, 500). The rows are observations of these 1000 drunk men, the 500 columns record their positions from the 1st step to the 500th step b) (20 points) Calculate the center and spread of the histogram. That means, calculate the average of all positions in Drunkmen. You won't get any points if the center is calculated by any formula, such as 500-500 -= 0. And calculate the standard deviation of these positions in Drunkmen


