Answered step by step
Verified Expert Solution
Question
1 Approved Answer
Suppose a random sample of US Adults had these results as shown in the below continguency table. Those in the survey were asked to identify
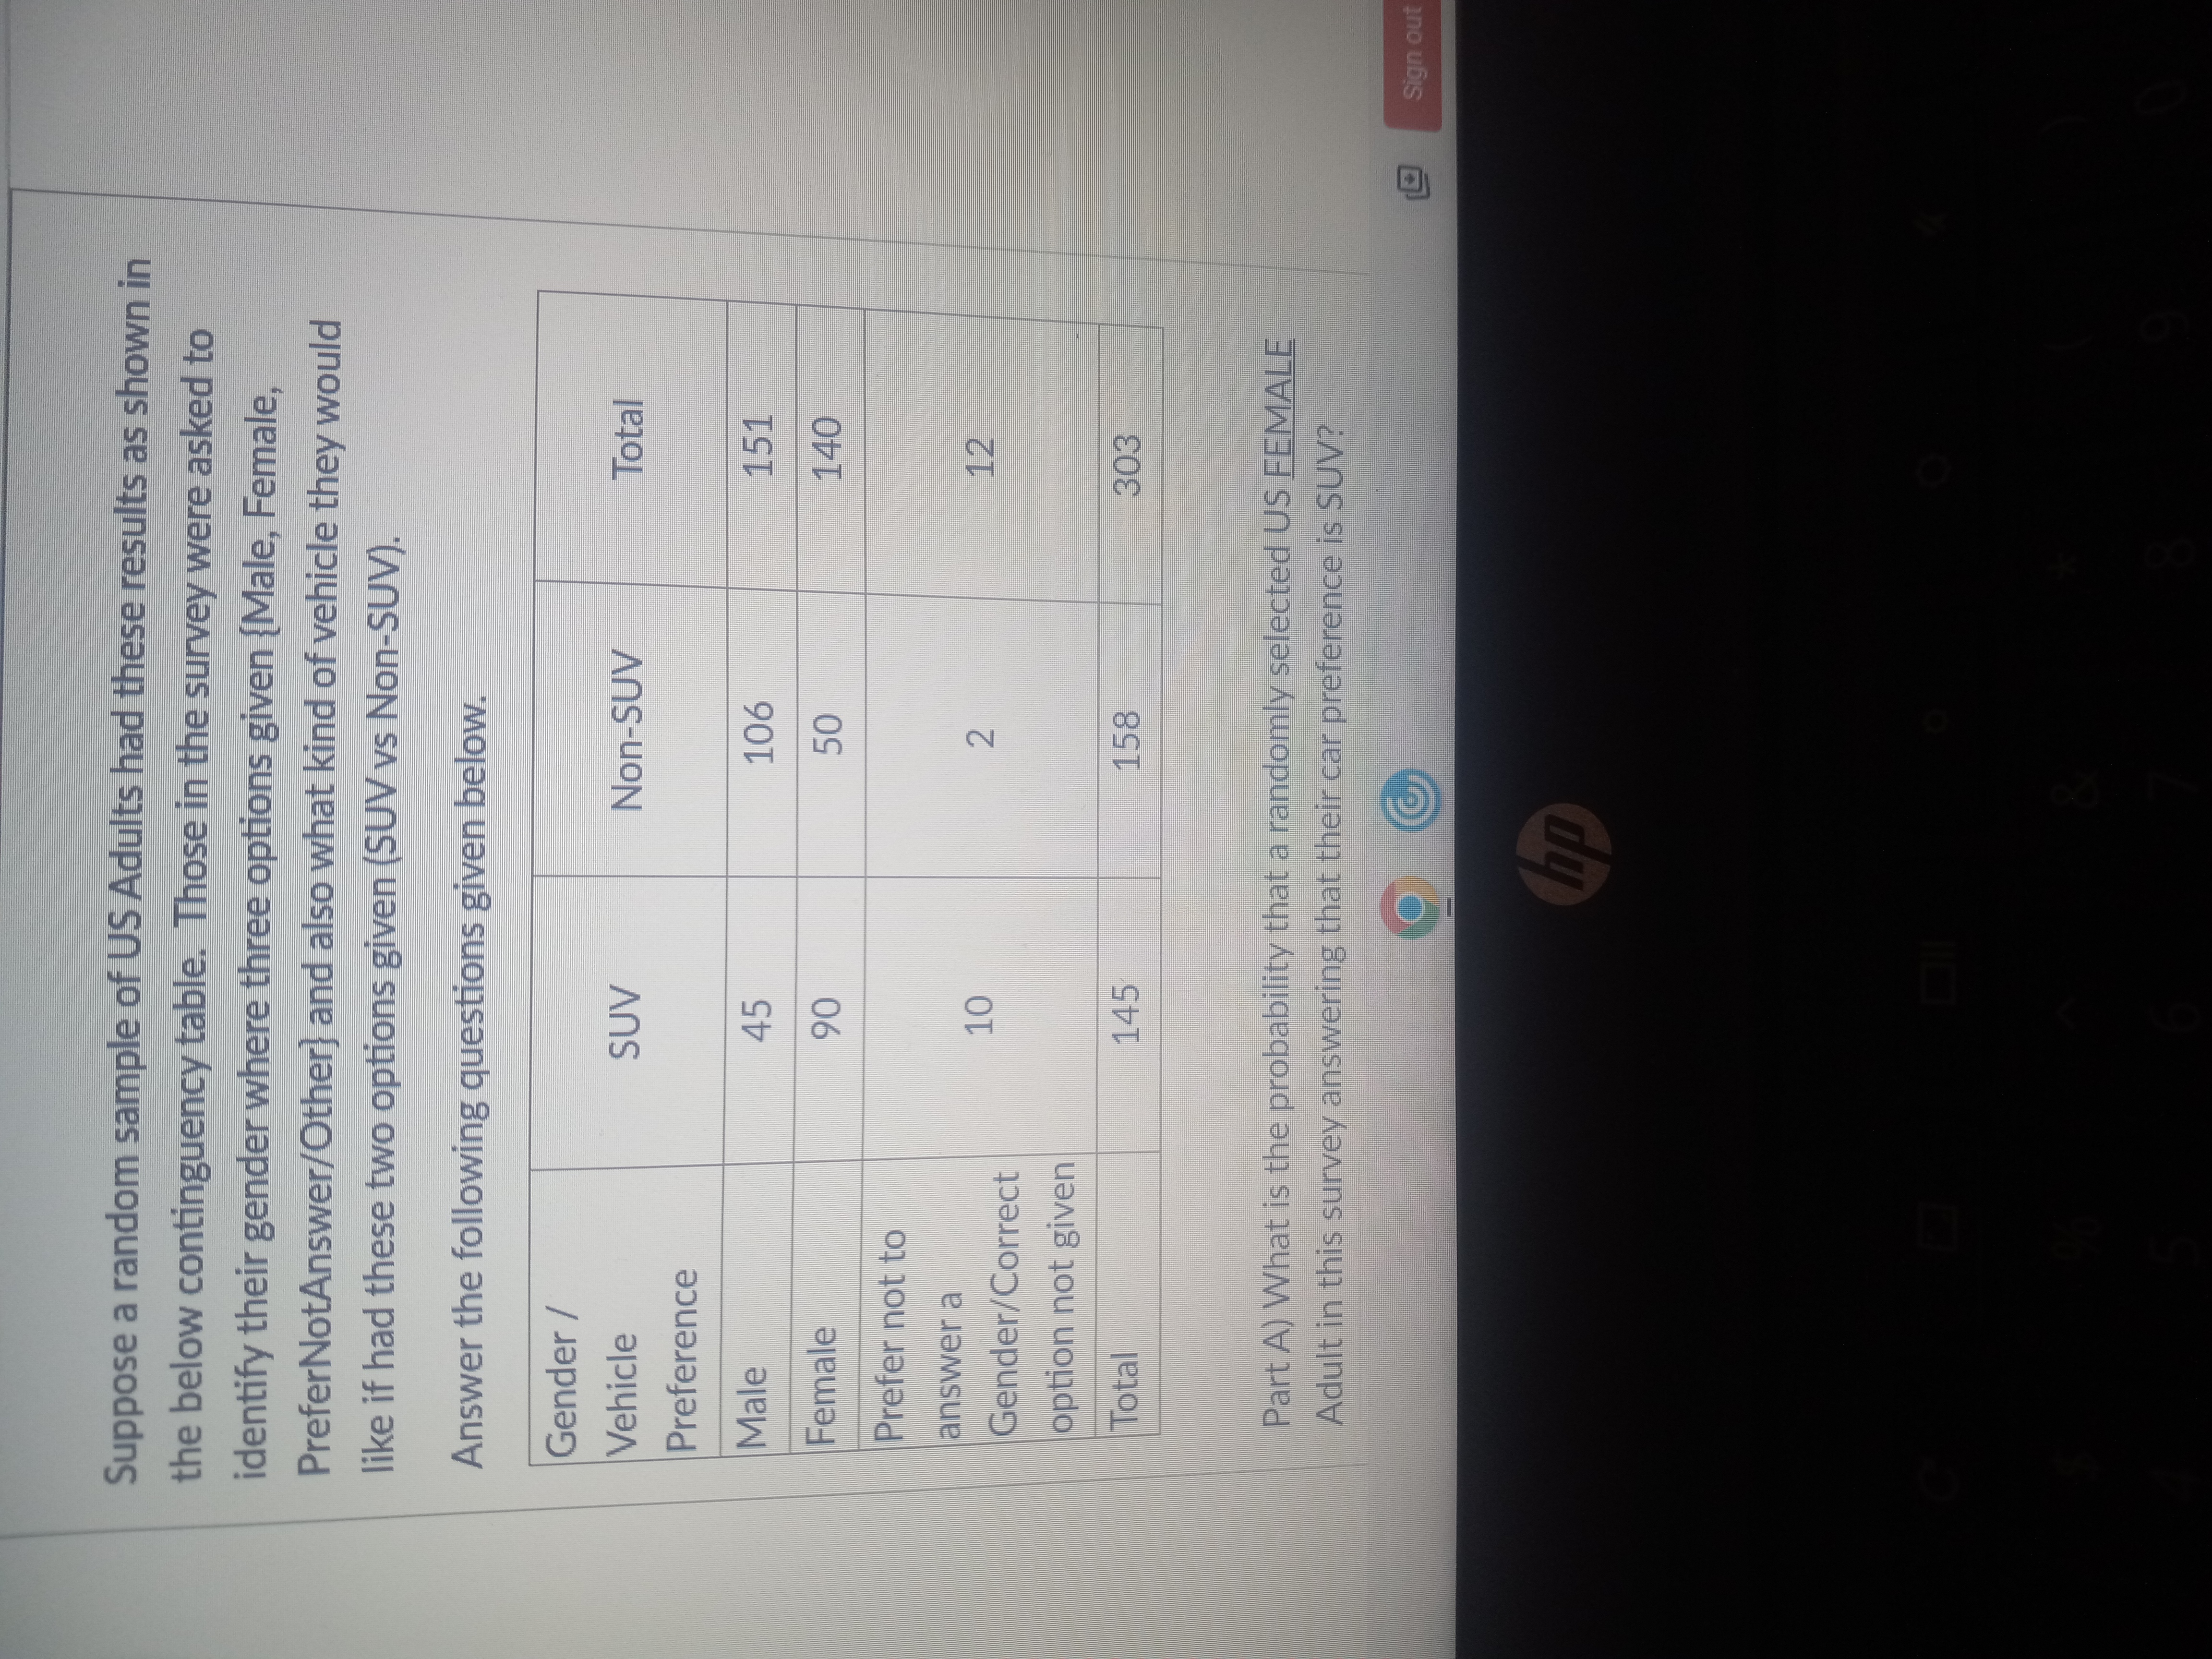
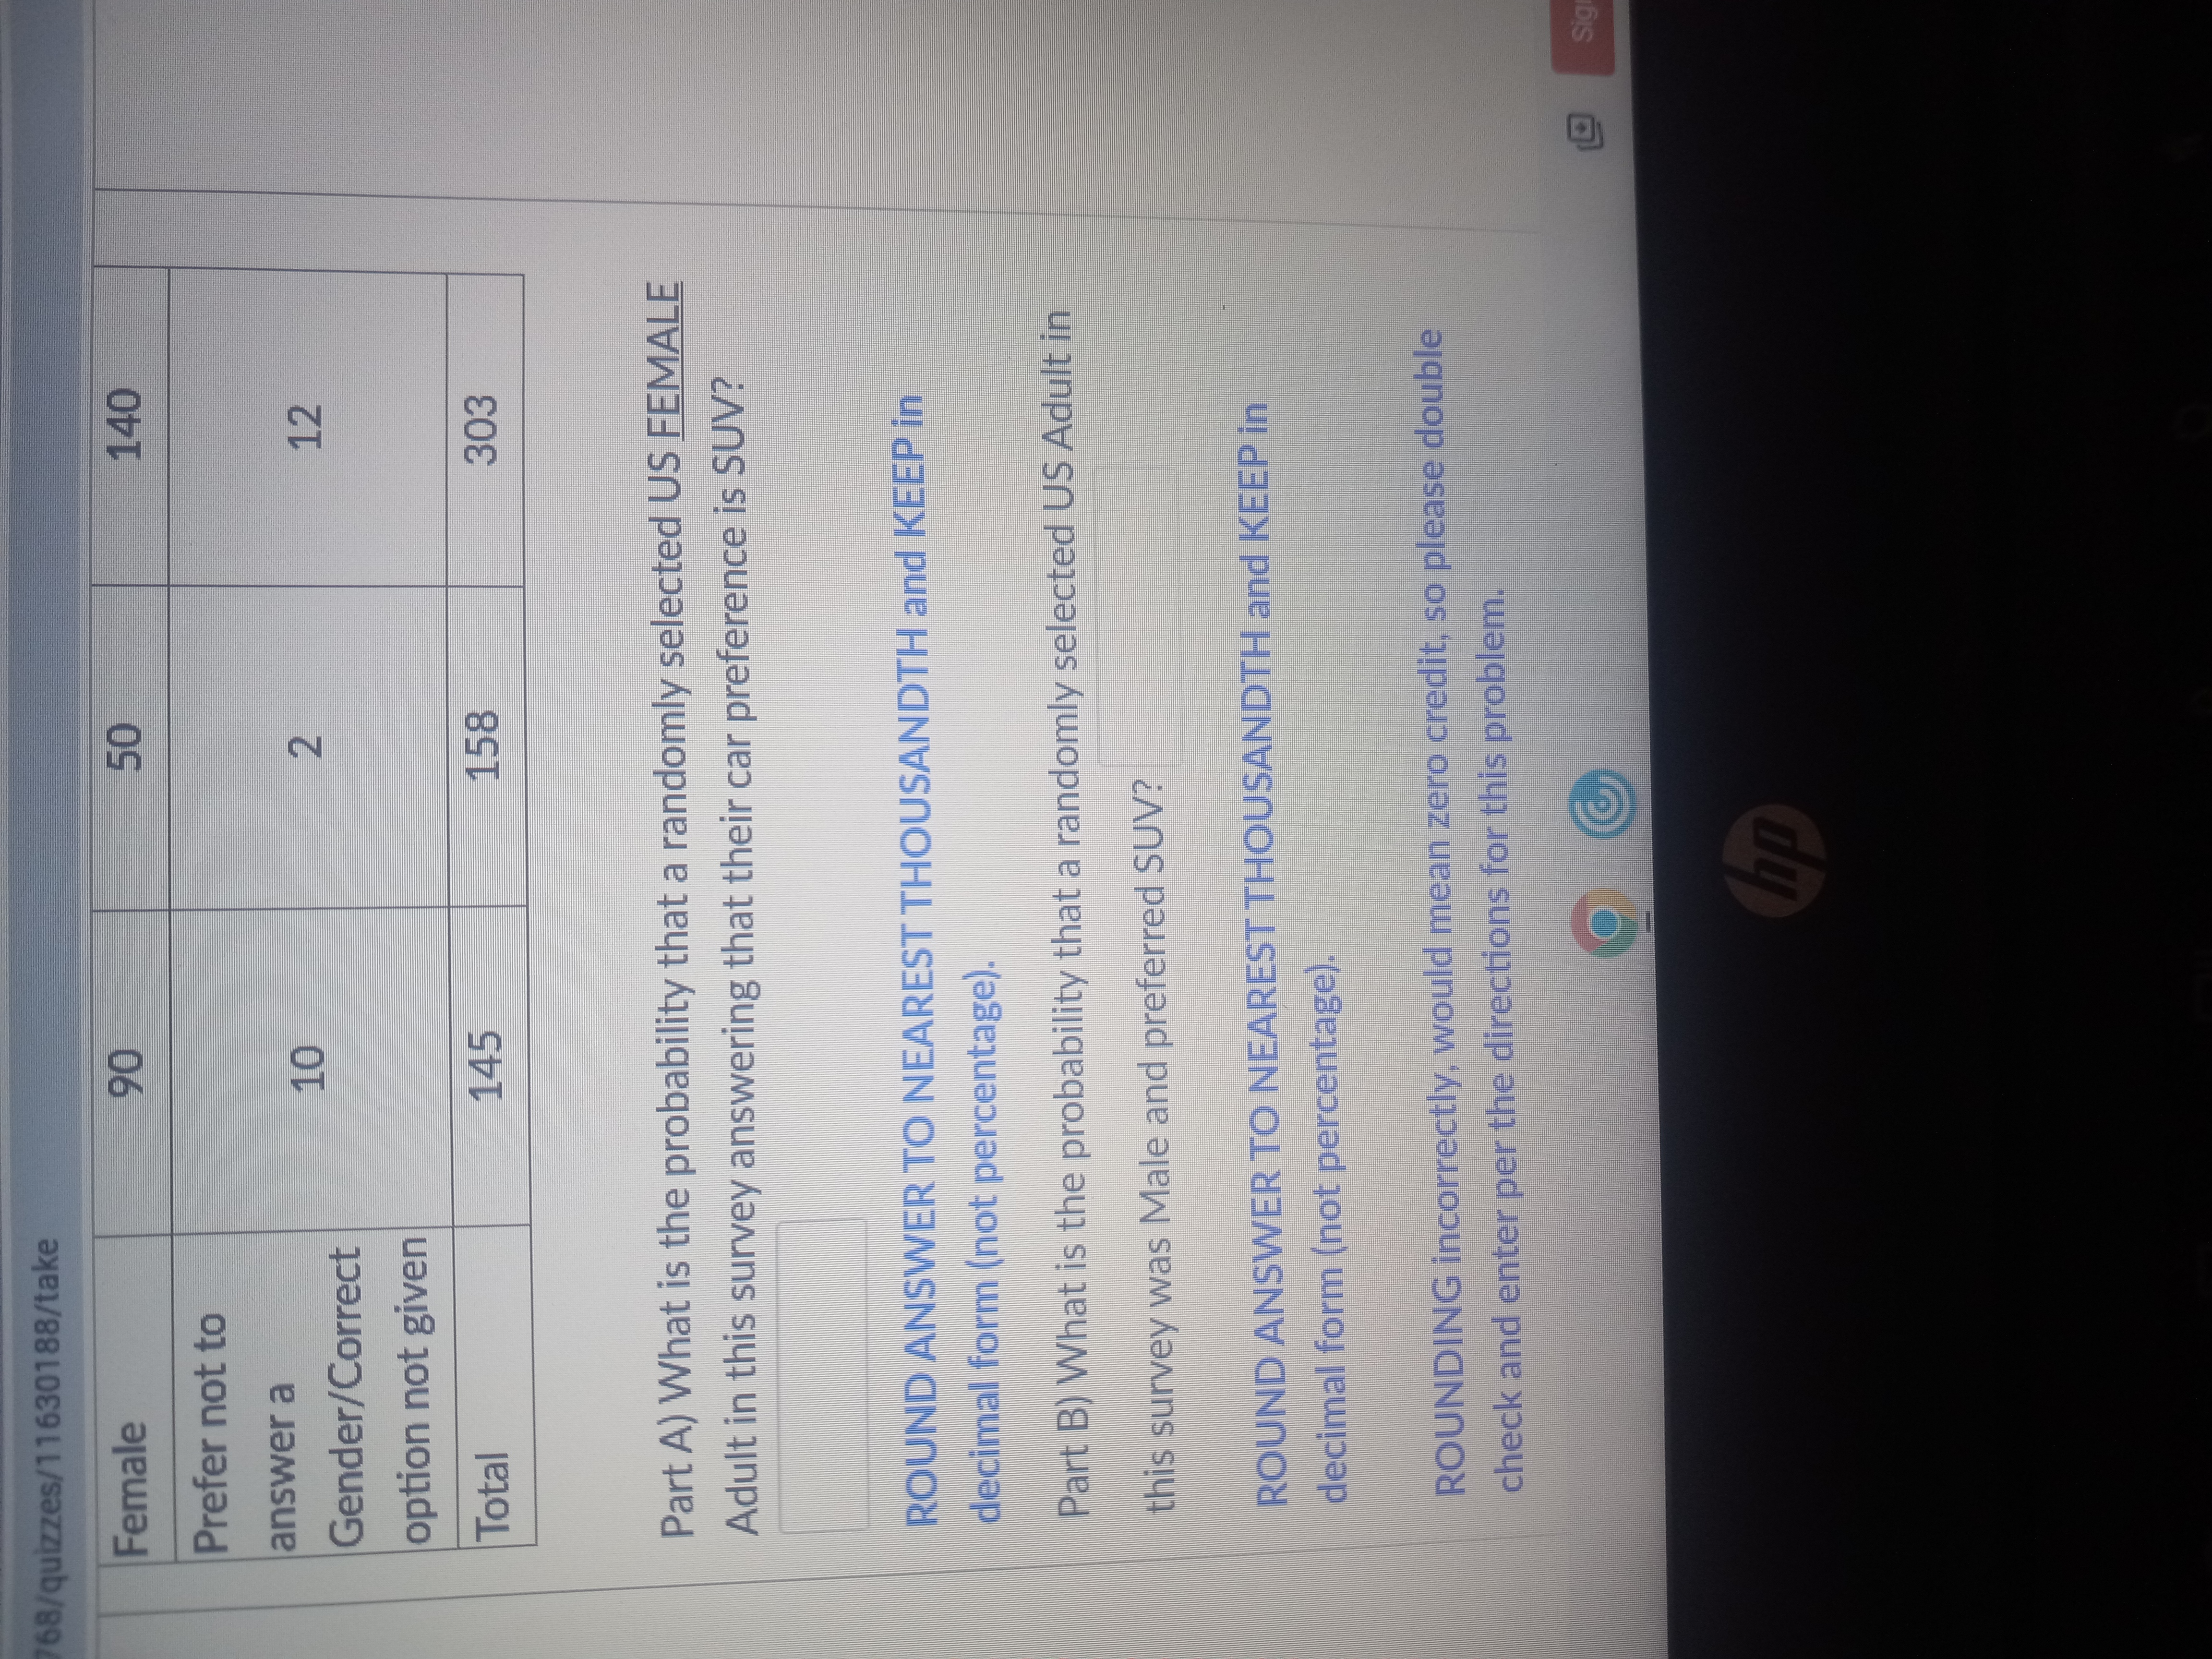
Suppose a random sample of US Adults had these results as shown in the below continguency table. Those in the survey were asked to identify their gender where three options given [Male, Female, PreferNotAnswer/Other] and also what kind of vehicle they would like if had these two options given (SUV vs Non-SUV). Answer the following questions given below. Gender / Vehicle SUV Non-SUV Total Preference Male 45 106 151 Female 90 50 140 Prefer not to answer a 10 2 12 Gender/Correct option not given Total 145 158 303 Part A) What is the probability that a randomly selected US FEMALE Adult in this survey answering that their car preference is SUV? Sign out hp768/quizzes/11630188/take Female 90 50 140 Prefer not to answer a 10 2 12 Gender/Correct option not given Total 145 158 303 Part A) What is the probability that a randomly selected US FEMALE Adult in this survey answering that their car preference is SUV? ROUND ANSWER TO NEAREST THOUSANDTH and KEEP in decimal form (not percentage). Part B) What is the probability that a randomly selected US Adult in this survey was Male and preferred SUV? ROUND ANSWER TO NEAREST THOUSANDTH and KEEP in decimal form (not percentage). ROUNDING incorrectly, would mean zero credit, so please double check and enter per the directions for this problem. Sig hp
Step by Step Solution
There are 3 Steps involved in it
Step: 1
Get Instant Access to Expert-Tailored Solutions
See step-by-step solutions with expert insights and AI powered tools for academic success
Step: 2
Step: 3
Ace Your Homework with AI
Get the answers you need in no time with our AI-driven, step-by-step assistance
Get Started