

Question
Suppose a researcher gathered survey data from 19 employees and asked the employees to rate their job satisfaction on a scale from 0 to 100
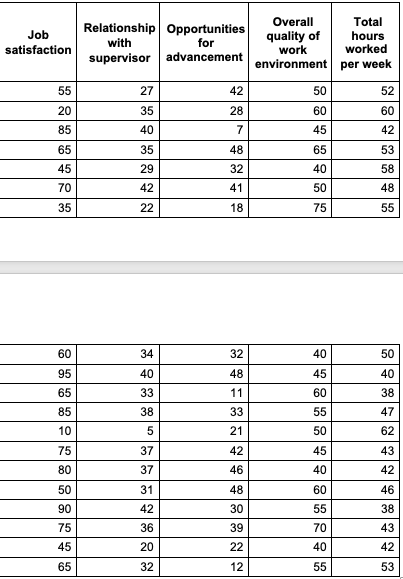
Suppose a researcher gathered survey data from 19 employees and asked the employees to rate their job satisfaction on a scale from 0 to 100 (with 100 being perfectly satisfied). Suppose the following data represent the results of this survey. Assume that relationship with their supervisor is rated on a scale from 0 to 50 (0 represents a poor relationship and 50 represents an excellent relationship); overall quality of the work environment is rated on a scale from 0 to 100 (0 represents poor work environment and 100 represents an excellent work environment); and opportunities for advancement is rated on a scale from 0 to 100 (0 represents no opportunities and 100 represents excellent opportunities).
I don't know how to use the data analysis regression chart. I'm confused on the x-y input.
Step by Step Solution
There are 3 Steps involved in it
Step: 1

Get Instant Access to Expert-Tailored Solutions
See step-by-step solutions with expert insights and AI powered tools for academic success
Step: 2

Step: 3
Ace Your Homework with AI
Get the answers you need in no time with our AI-driven, step-by-step assistance
Get Started
Prealgebra
Authors: Elayn Martin Gay
7th edition
321955048, 978-0321955043