

Answered step by step
Verified Expert Solution
Question
1 Approved Answer
Suppose a student conducted a lab to determine absolute zero by varying the temperature and measuring the pressure at a constant volume. The data collected
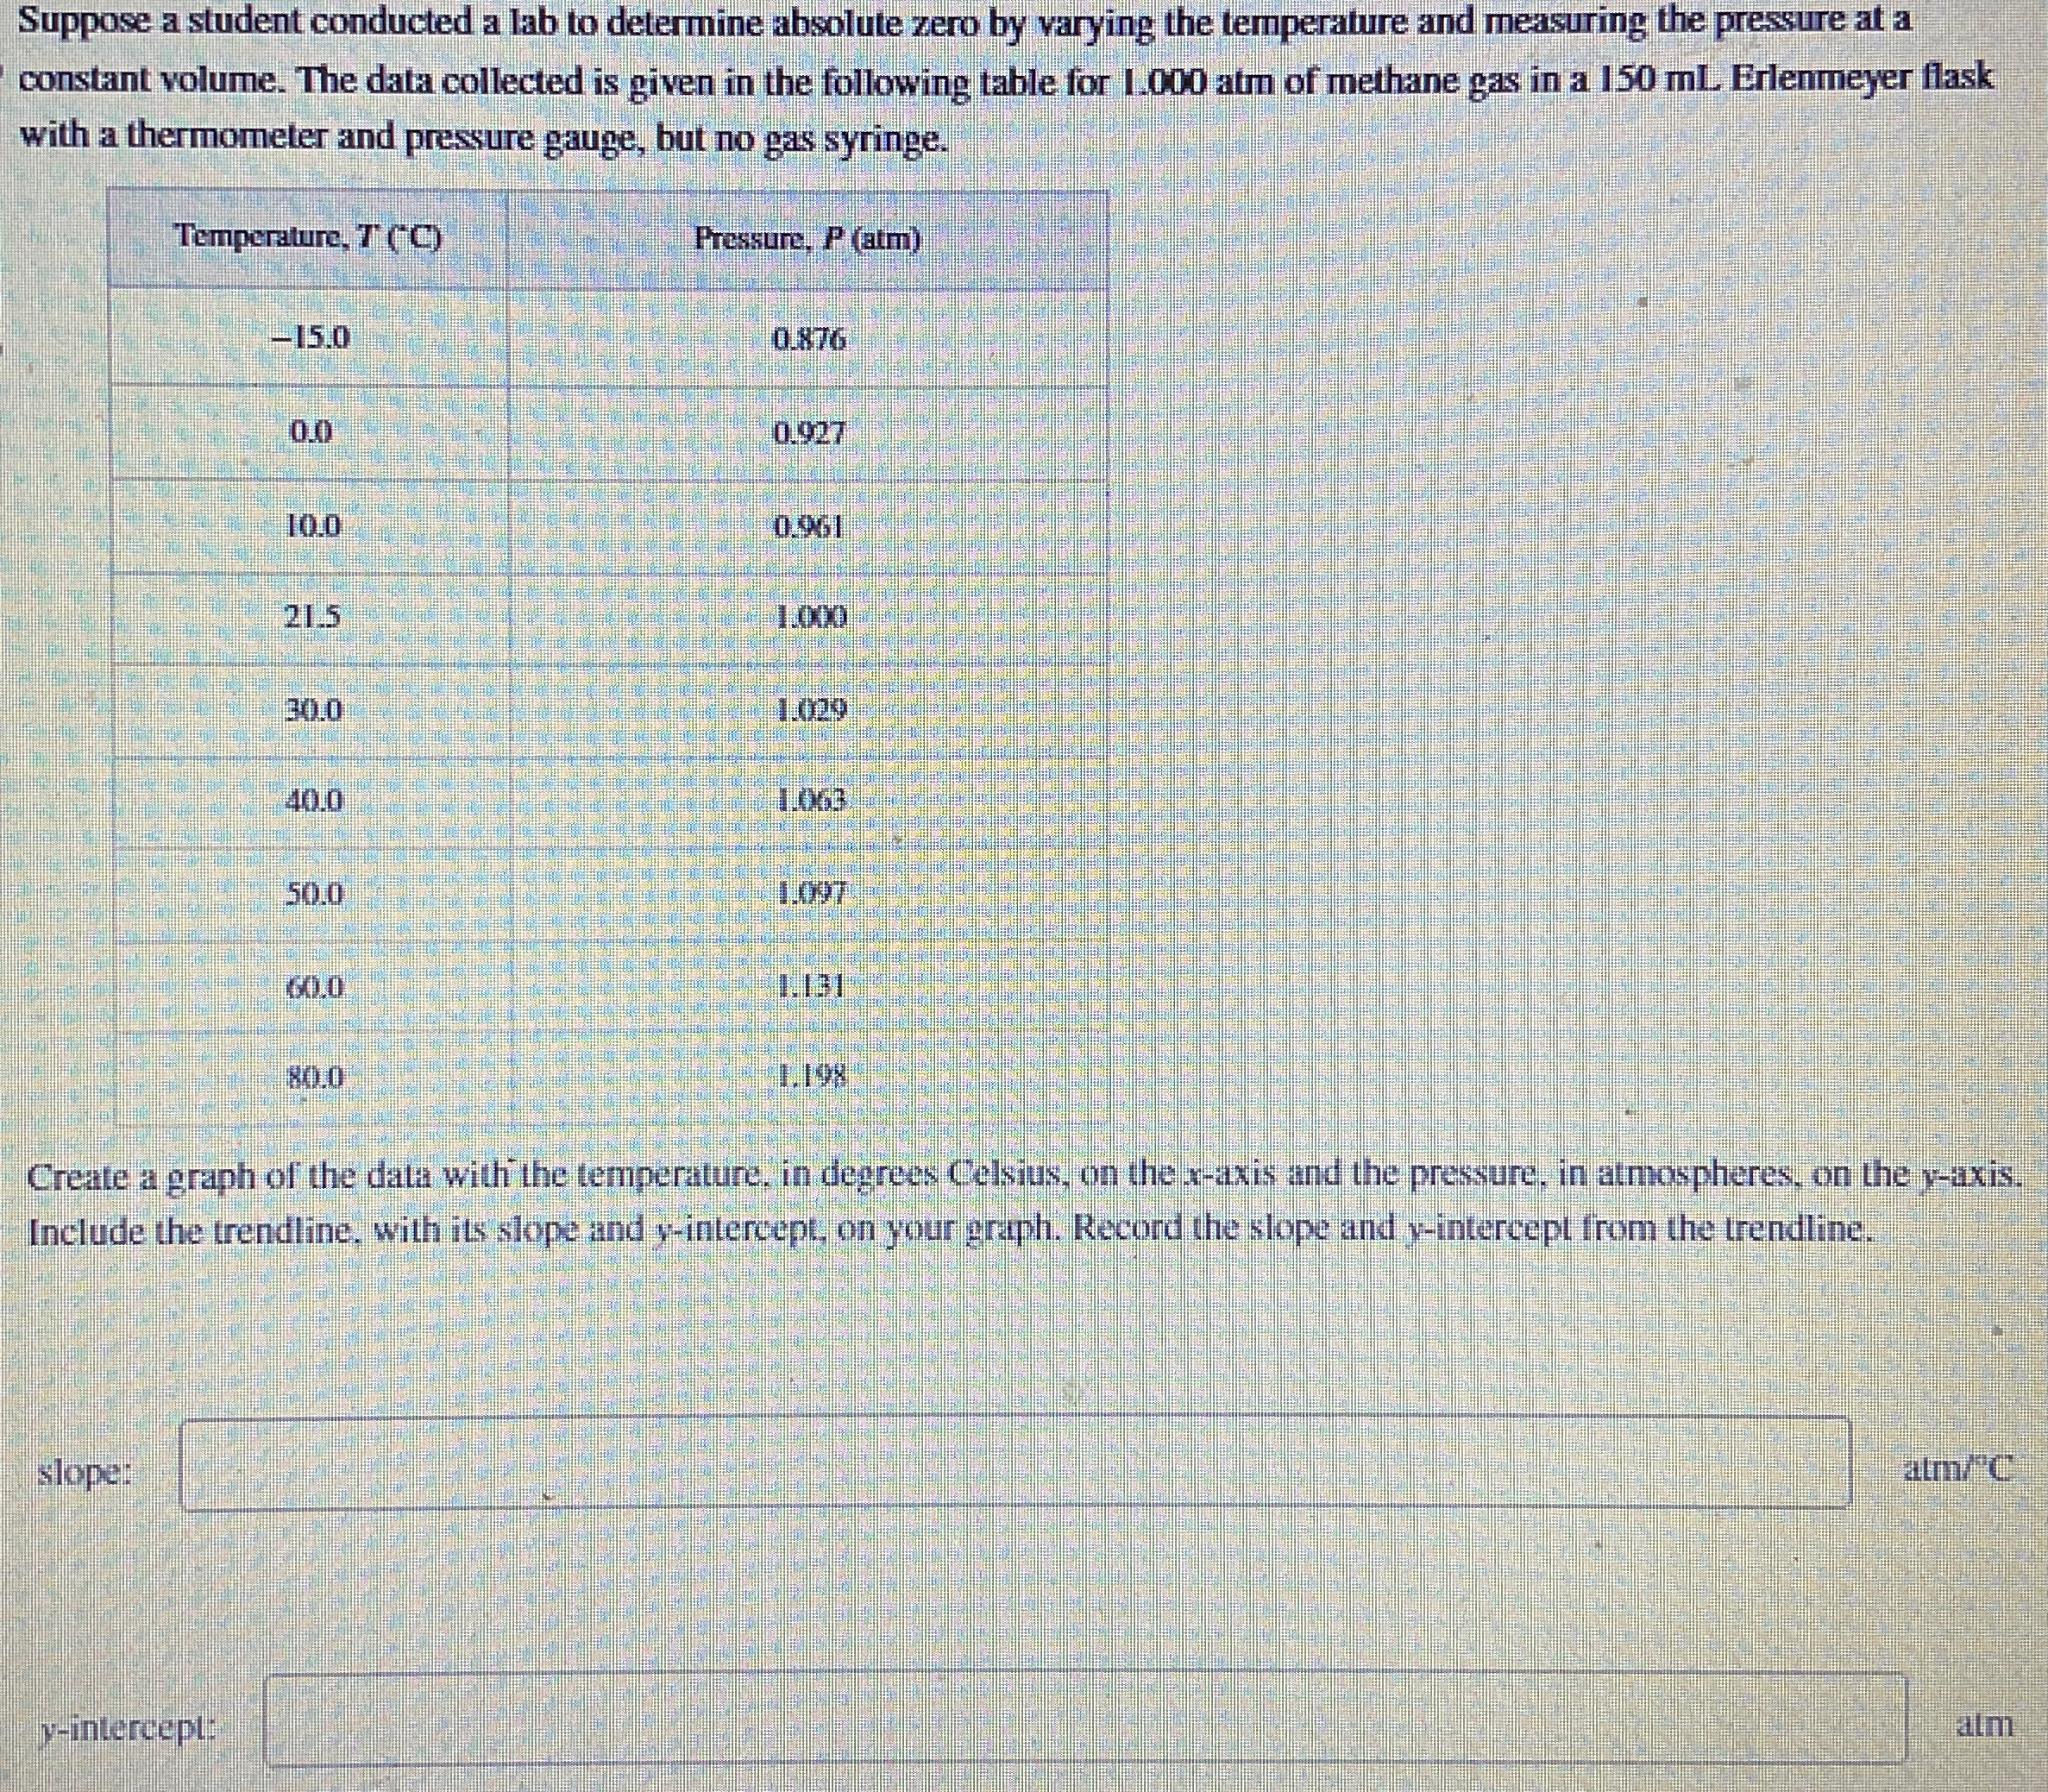
Suppose a student conducted a lab to determine absolute zero by varying the temperature and measuring the pressure at a constant volume. The data collected is given in the following table for atm of methane gas in a Erlenmeyer flask with a thermometer and pressure gauge, but no gas syringe.
tableTemperatureCPressure, atm
Create a graph of the data with the temperature, in degrees Celsius, on the axis and the pressure, in atmospheres, on the axis. Include the trendline, with its slope and intercept, on your graph. Record the slope and intercept from the trendline.
slope:
intercept:
atm
Step by Step Solution
There are 3 Steps involved in it
Step: 1

Get Instant Access to Expert-Tailored Solutions
See step-by-step solutions with expert insights and AI powered tools for academic success
Step: 2

Step: 3
Ace Your Homework with AI
Get the answers you need in no time with our AI-driven, step-by-step assistance
Get Started
Quantitative Chemical Analysis
Authors: Daniel C. Harris
9th Edition
146413538X, 978-1464135385