

Question
Suppose a student conducts a fair coin flip experiment and records the proportion of heads from flipping a fair coin 10? times. After repeating the
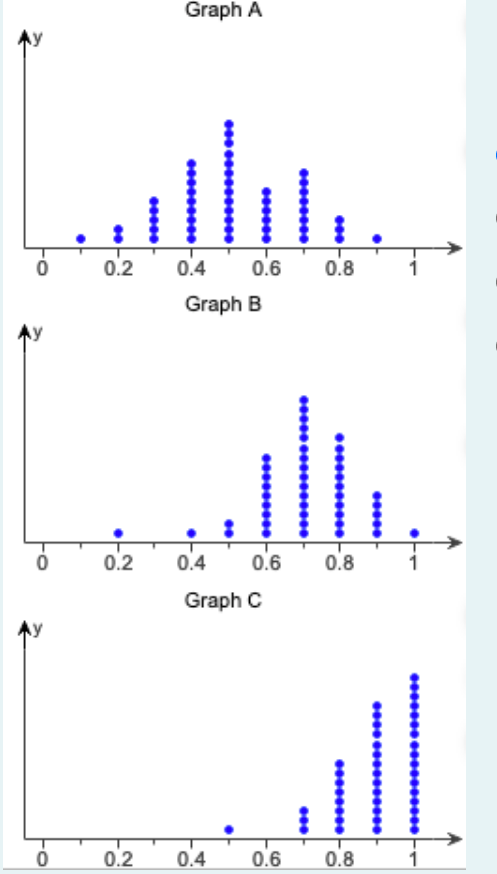
Suppose a student conducts a fair coin flip experiment and records the proportion of heads from flipping a fair coin 10? times. After repeating the experiment many times, the student-constructed a distribution of the proportion of heads.
Which graph represents the sampling distribution?
Note: no option is an option, and they are flipping a fair coin ten times only.
Step by Step Solution
There are 3 Steps involved in it
Step: 1

Get Instant Access to Expert-Tailored Solutions
See step-by-step solutions with expert insights and AI powered tools for academic success
Step: 2

Step: 3
Ace Your Homework with AI
Get the answers you need in no time with our AI-driven, step-by-step assistance
Get Started
Finite Math And Applied Calculus
Authors: Stefan Waner, Steven Costenoble
6th Edition
1285415132, 9781285415130