Answered step by step
Verified Expert Solution
Question
1 Approved Answer
Suppose a survey was conducted in which participants were asked to disclose their favorite night for a particular activity. The results are summarized in


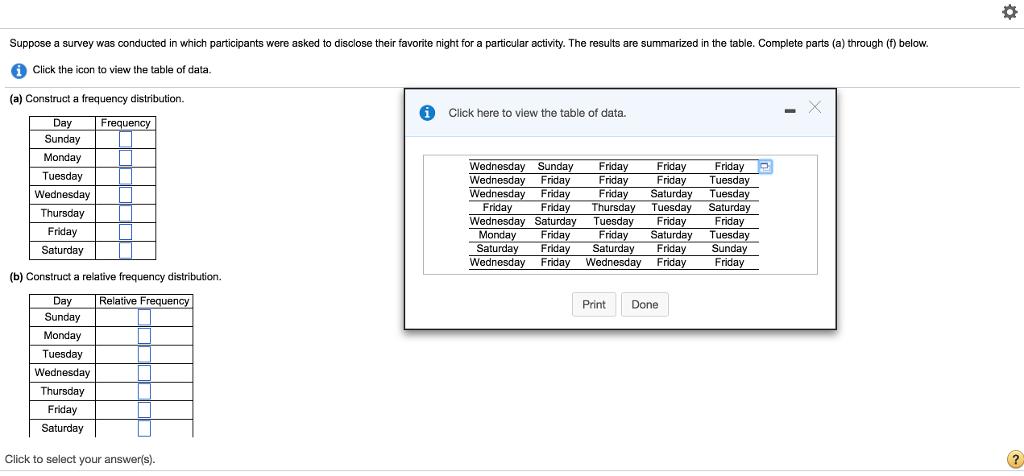
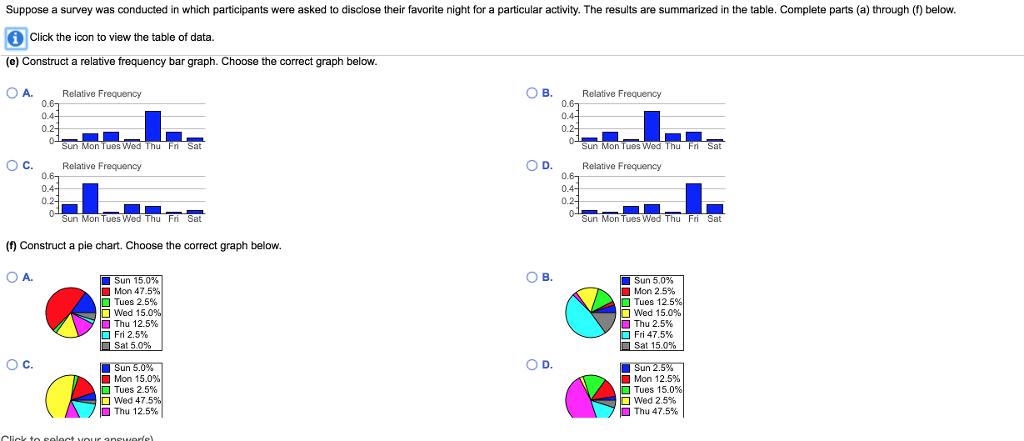
Suppose a survey was conducted in which participants were asked to disclose their favorite night for a particular activity. The results are summarized in the table. Complete parts (a) through (f) below. Click the icon to view the table of data. (a) Construct a frequency distribution. 6 Click here to view the table of data. Day Frequency Sunday Monday Wednesday Sunday Wednesday Friday Friday Friday Wednesday Saturday Friday Friday Friday Friday Friday Thursday Tuesday Friday Saturday Friday Friday Saturday Tuesday Friday Tuesday Tuesday Saturday Tuesday Wednesday Friday Wednesday Thursday Friday Friday Tuesday Sunday Friday Friday Monday Saturday Saturday Friday Saturday Wednesday Friday Wednesday Friday (b) Construct a relative frequency distribution. Relative Frequency Day Sunday Print Done Monday Tuesday Wednesday Thursday Friday Saturday Click to select your answer(s). Suppose a survey was conducted in which participants were asked to disclose their favorite night for a particular activity. The results are summarized in the table. Complete parts (a) through (f) below. i Click the icon to view the table of data. Tmurauay Friday Saturday (Round to three decimal places as needed.) (c) If you own a business that sels products related to the activity, which day would you purchase an advertisement in the local newspaper? Are there any days you would avoid purchasing advertising space? The best day to purchase advertising would probably be The worst day to purchase advertising would probably be (d) Construct a frequency bar graph. Choose the correct graph below. OA. OB. Sun Mon Tuos Wed Thu Fri Sat Sun Mon Tues Wed Thu Fri Sat Oc. OD. Sun Mon Tues Wed Thu Fri Sat Sun Mon Tues Fr Sot (e) Construct a relative frequency bar graph. Choose the correct graph below. Suppose a survey was conducted in which participants were asked to disclose their favorite night for a particular activity. The results are summarized in the table. Complete parts (a) through (f) below. A Click the icon to view the table of data. (e) Construct a relative frequency bar graph. Choose the correct graph below. O A. Relative Frequency 0.6- OB. 0.4- 0.2- Relative Frequency 0.6 0.4- 0.2- Sun Mon Tues Wed Thu Fn Sat Sun Mon Tues Wed Thu Fr Sat Oc. O Relative Frequency 0.6- 0.4- 0.24 D. Relative Frequency 0.67 0.4- 0.2- Sun Mon Tues Wed Thu Fri Sat ol Sun Mon Tues Wed Thu Fri Sat (f) Construct a pie chart. Choose the correct graph below. OA. OB. Sun 15.0% Mon 47.5% O Tues 2.5% Wed 15.0% O Thu 12.5% O Fri 2.5% O Sat 5.0% I Sun 5.0% O Mon 2.5% O Tues 12.5% O Wed 15.0% O Thu 2.5% O Fri 47.5% O Sat 15.0% Oc. OD. Sun 5.0% O Mon 15.0% O Tues 2.5% Wed 47.5% O Thu 12.5% I Sun 2.5% I Mon 12.5% O Tues 15.0% O Wed 2.5% O Thu 47.5% Click to eelect vour anewerle)
Step by Step Solution
★★★★★
3.38 Rating (167 Votes )
There are 3 Steps involved in it
Step: 1

Get Instant Access to Expert-Tailored Solutions
See step-by-step solutions with expert insights and AI powered tools for academic success
Step: 2

Step: 3

Ace Your Homework with AI
Get the answers you need in no time with our AI-driven, step-by-step assistance
Get Started


