

Answered step by step
Verified Expert Solution
Question
1 Approved Answer
Suppose each customer purchase of a product generates $10 in profit. Each month a customer either buys 0 or 1 units of the product. If
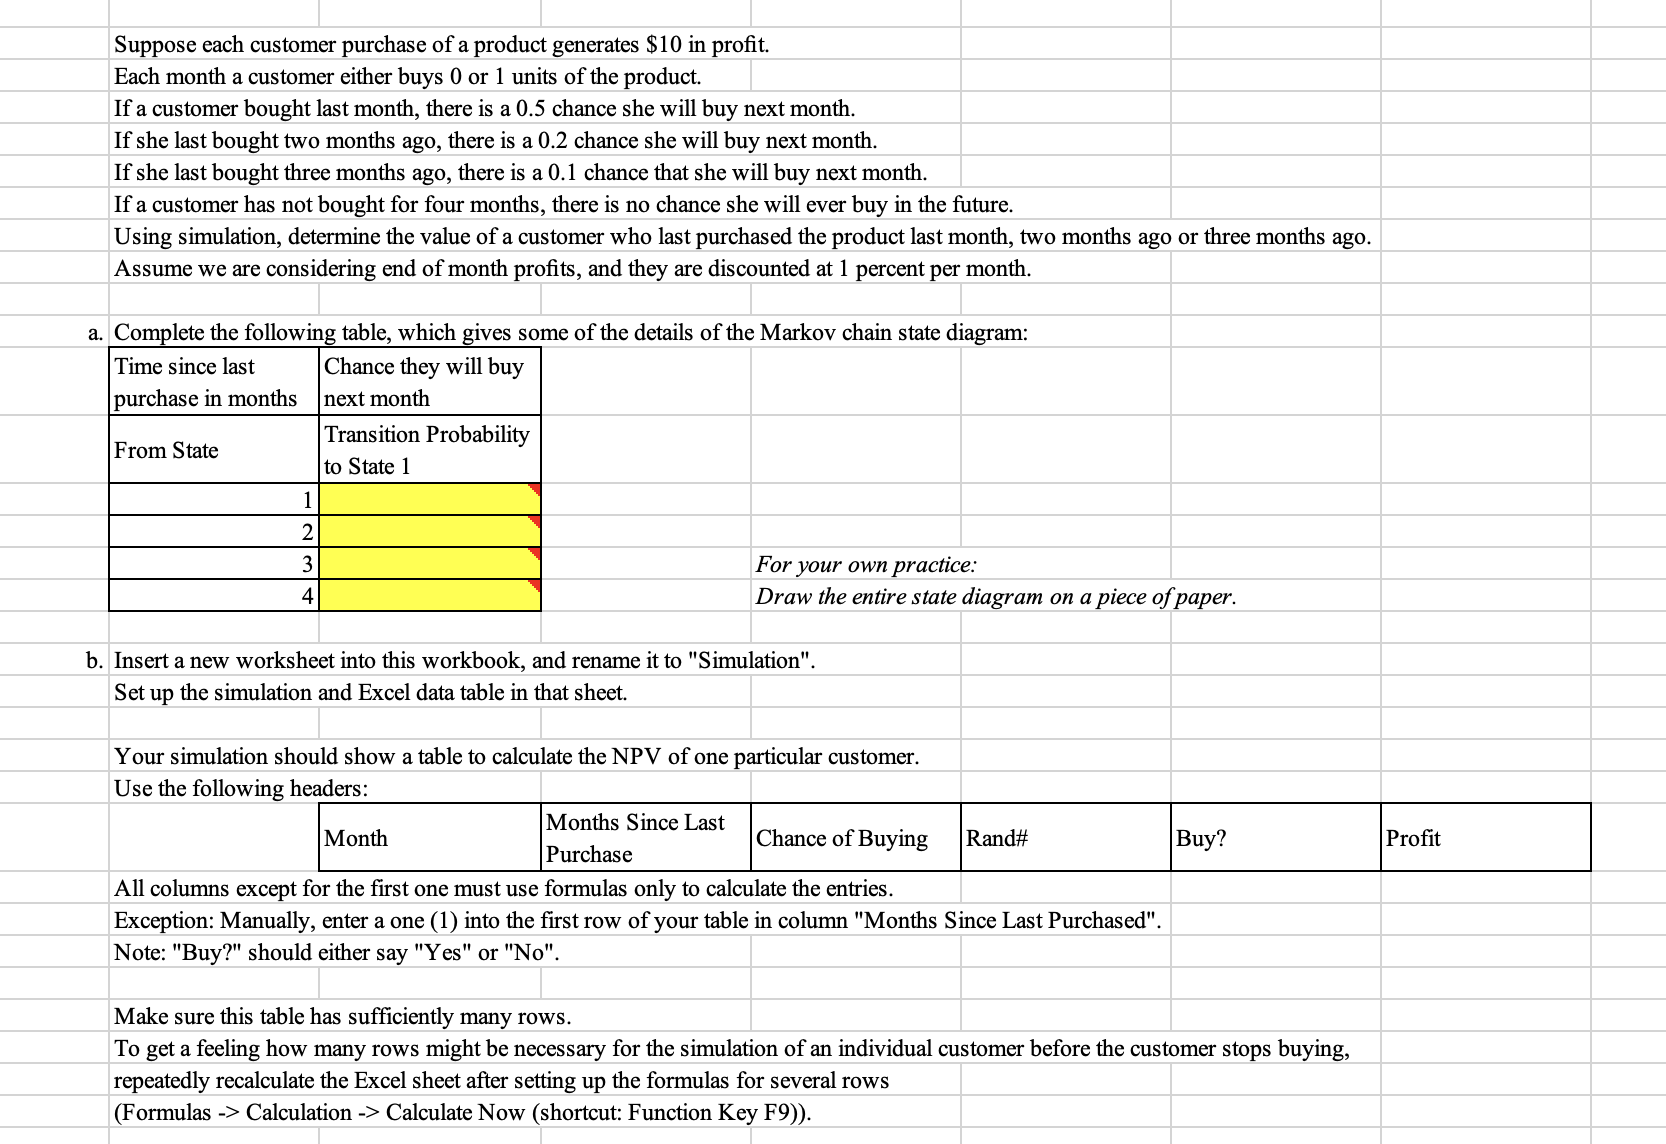 Suppose each customer purchase of a product generates $10 in profit. Each month a customer either buys 0 or 1 units of the product. If a customer bought last month, there is a 0.5 chance she will buy next month. If she last bought two months ago, there is a 0.2 chance she will buy next month. If she last bought three months ago, there is a 0.1 chance that she will buy next month. If a customer has not bought for four months, there is no chance she will ever buy in the future. Using simulation, determine the value of a customer who last purchased the product last month, two months ago or three months ago. Assume we are considering end of month profits, and they are discounted at 1 percent per month. a. Complete the following table, which gives some of the details of the Markov chain state diagram: \begin{tabular}{|l|l|} \hline Timesincelastpurchaseinmonths & Chancetheywillbuynextmonth \\ \hline From State & TransitionProbabilitytoState1 \\ \hline 1 & \\ \hline 2 & \\ \hline 3 & \\ \hline 4 & \\ \hline \end{tabular} For your own practice: Draw the entire state diagram on a piece of paper. b. Insert a new worksheet into this workbook, and rename it to "Simulation". Set up the simulation and Excel data table in that sheet. Your simulation should show a table to calculate the NPV of one particular customer. Use the following headers: \begin{tabular}{|l|l|l|l|l|l|} \hline Month & MonthsSinceLastPurchase & Chance of Buying & Rand\# Buy? & Profit \\ \hline \end{tabular} All columns except for the first one must use formulas only to calculate the entries. Exception: Manually, enter a one (1) into the first row of your table in column "Months Since Last Purchased". Note: "Buy?" should either say "Yes" or "No". Make sure this table has sufficiently many rows. To get a feeling how many rows might be necessary for the simulation of an individual customer before the customer stops buying, repeatedly recalculate the Excel sheet after setting up the formulas for several rows (Formulas -> Calculation -> Calculate Now (shortcut: Function Key F9)). Suppose each customer purchase of a product generates $10 in profit. Each month a customer either buys 0 or 1 units of the product. If a customer bought last month, there is a 0.5 chance she will buy next month. If she last bought two months ago, there is a 0.2 chance she will buy next month. If she last bought three months ago, there is a 0.1 chance that she will buy next month. If a customer has not bought for four months, there is no chance she will ever buy in the future. Using simulation, determine the value of a customer who last purchased the product last month, two months ago or three months ago. Assume we are considering end of month profits, and they are discounted at 1 percent per month. a. Complete the following table, which gives some of the details of the Markov chain state diagram: \begin{tabular}{|l|l|} \hline Timesincelastpurchaseinmonths & Chancetheywillbuynextmonth \\ \hline From State & TransitionProbabilitytoState1 \\ \hline 1 & \\ \hline 2 & \\ \hline 3 & \\ \hline 4 & \\ \hline \end{tabular} For your own practice: Draw the entire state diagram on a piece of paper. b. Insert a new worksheet into this workbook, and rename it to "Simulation". Set up the simulation and Excel data table in that sheet. Your simulation should show a table to calculate the NPV of one particular customer. Use the following headers: \begin{tabular}{|l|l|l|l|l|l|} \hline Month & MonthsSinceLastPurchase & Chance of Buying & Rand\# Buy? & Profit \\ \hline \end{tabular} All columns except for the first one must use formulas only to calculate the entries. Exception: Manually, enter a one (1) into the first row of your table in column "Months Since Last Purchased". Note: "Buy?" should either say "Yes" or "No". Make sure this table has sufficiently many rows. To get a feeling how many rows might be necessary for the simulation of an individual customer before the customer stops buying, repeatedly recalculate the Excel sheet after setting up the formulas for several rows (Formulas -> Calculation -> Calculate Now (shortcut: Function Key F9))
 Step by Step Solution
There are 3 Steps involved in it
Step: 1

Get Instant Access to Expert-Tailored Solutions
See step-by-step solutions with expert insights and AI powered tools for academic success
Step: 2

Step: 3
Ace Your Homework with AI
Get the answers you need in no time with our AI-driven, step-by-step assistance
Get Started
Day Trading Strategies And Risk Management
Authors: Richard N. Williams
1st Edition
979-8863610528