

Answered step by step
Verified Expert Solution
Question
1 Approved Answer
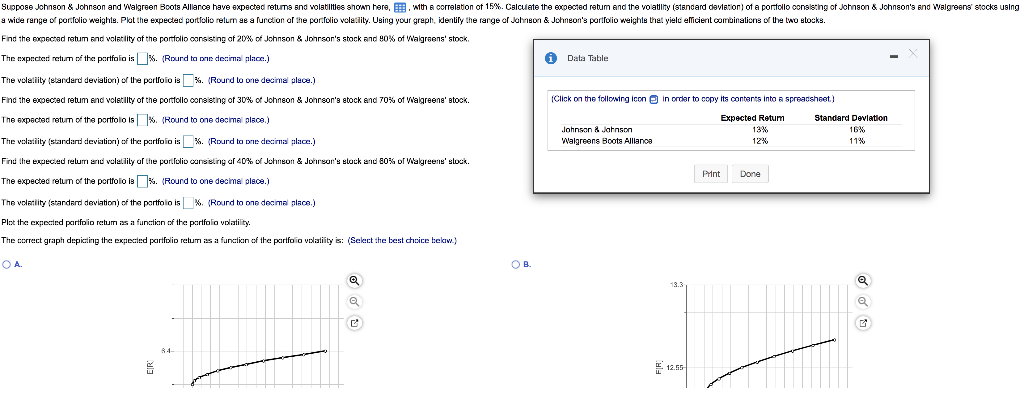
Suppose Johnson & Johnson and Walgreen Boots Alliance have expected returns snd volatilities shown here, with a correlation of 15%. Calculete the expected retum and
Step by Step Solution
There are 3 Steps involved in it
Step: 1

Get Instant Access to Expert-Tailored Solutions
See step-by-step solutions with expert insights and AI powered tools for academic success
Step: 2

Step: 3
Ace Your Homework with AI
Get the answers you need in no time with our AI-driven, step-by-step assistance
Get Started
F For Quantitative Finance
Authors: Johan Astborg
1st Edition
1782164626, 978-1782164623