Question
Suppose Kenji earns $300,000 a year as a deep-sea diver. He knows there is a 25% chance of death associated with deep-sea diving, and although
Suppose Kenji earns $300,000 a year as a deep-sea diver. He knows there is a 25% chance of death associated with deep-sea diving, and although his wife could work and earn $100,000 a year if he died, he decides to purchase a life insurance policy to minimize his family's risk.
Consider the following graph depicting Kenji's family's consumption in the two states of the world, one in which he lives (horizontal axis) and one in which he dies (vertical axis). The grey point (star symbol) is representative of the fact that without insurance, the family will consume $300,000 if Kenji lives (the good state) and $100,000 if he dies (the bad state). The given indifference curves depict the family's preferences for consumption between the two states.
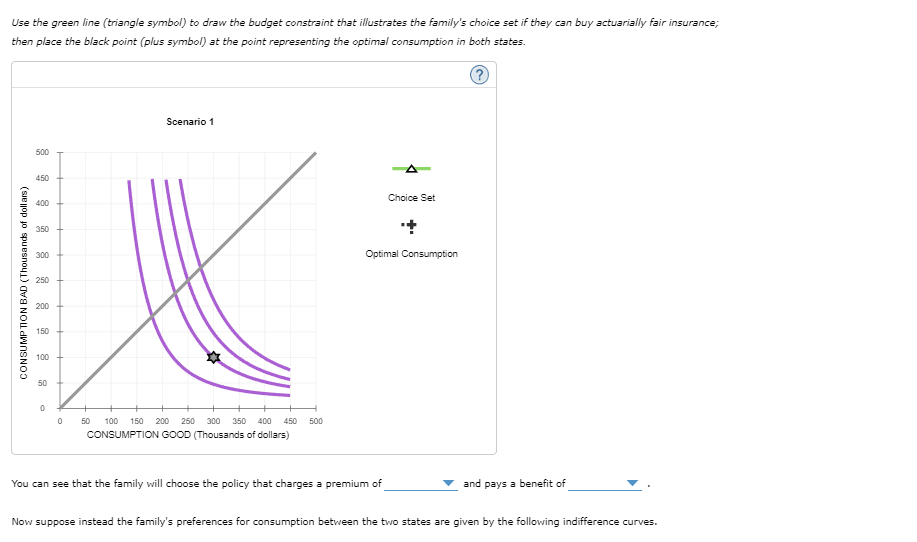
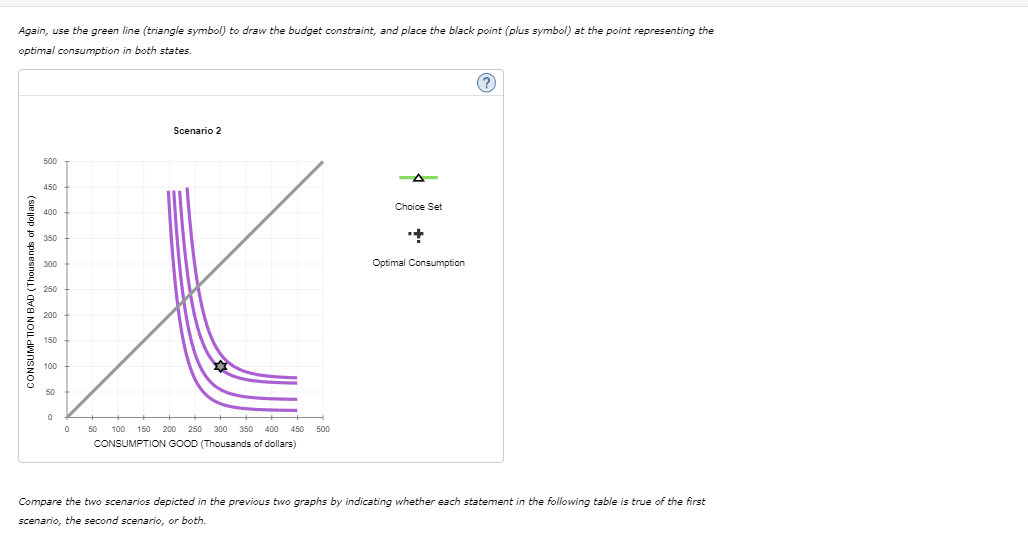
Use the green line (triangle symbol) to draw the budget constraint that illustrates the family's choice set if they can buy actuarially fair insurance; then place the black point (plus symbol) at the point representing the optimal consumption in both states. You can see that the family will choose the policy that charges a premium of and pays a benefit of Now suppose instead the family's preferences for consumption between the two states are given by the following indifference curves. Again, use the green line (triangle symbol) to draw the budget constraint, and place the black point (plus symbol) at the point representing the optimal consumption in both states. Compare the two scenarios depicted in the previous two graphs by indicating whether each statement in the following table is true of the first scenario, the second scenario, or both. Compare the two scenarios depicted in the previous two graphs by indicating whether each statement in the following table is true of the first scenario, the second scenario, or both. Use the green line (triangle symbol) to draw the budget constraint that illustrates the family's choice set if they can buy actuarially fair insurance; then place the black point (plus symbol) at the point representing the optimal consumption in both states. You can see that the family will choose the policy that charges a premium of and pays a benefit of Now suppose instead the family's preferences for consumption between the two states are given by the following indifference curves. Again, use the green line (triangle symbol) to draw the budget constraint, and place the black point (plus symbol) at the point representing the optimal consumption in both states. Compare the two scenarios depicted in the previous two graphs by indicating whether each statement in the following table is true of the first scenario, the second scenario, or both. Compare the two scenarios depicted in the previous two graphs by indicating whether each statement in the following table is true of the first scenario, the second scenario, or bothStep by Step Solution
There are 3 Steps involved in it
Step: 1
Get Instant Access to Expert-Tailored Solutions
See step-by-step solutions with expert insights and AI powered tools for academic success
Step: 2
Step: 3
Ace Your Homework with AI
Get the answers you need in no time with our AI-driven, step-by-step assistance
Get Started