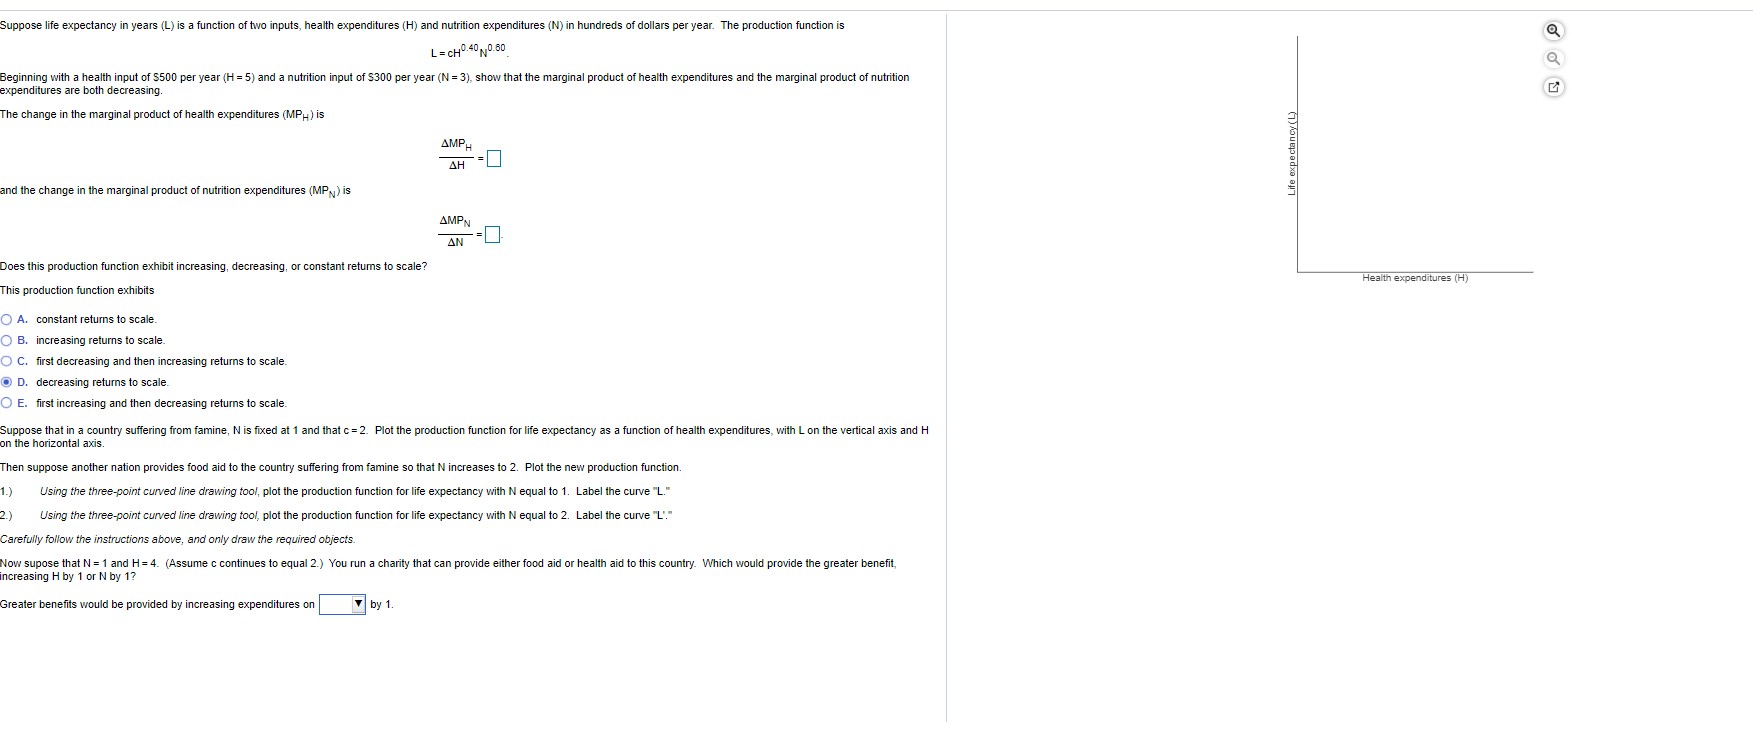
Suppose life expectancy in years (L) is a function of two inputs, health expenditures (H) and nutrition expenditures (N) in hundreds of dollars per year. The production function is L = CHO.40 NO.60 Beginning with a health input of $500 per year (H = 5) and a nutrition input of $300 per year (N = 3), show that the marginal product of health expenditures and the marginal product of nutrition expenditures are both decreasing. The change in the marginal product of health expenditures (MPH) is AMPH Life expectancy (L) AH and the change in the marginal product of nutrition expenditures (MP) is AMPN AN Does this production function exhibit increasing, decreasing, or constant retums to scale? Health expenditures (H) This production function exhibits A. constant returns to scale. O B. increasing returns to scale. O C. first decreasing and then increasing returns to scale. O D. decreasing returns to scale O E. first increasing and then decreasing returns to scale Suppose that in a country suffering from famine, N is fixed at 1 and that c = 2. Plot the production function for life expectancy as a function of health expenditures, with L on the vertical axis and H on the horizontal axis. Then suppose another nation provides food aid to the country suffering from famine so that N increases to 2. Plot the new production function. Using the three-point curved line drawing tool, plot the production function for life expectancy with N equal to 1. Label the curve "L." Using the three-point curved line drawing tool, plot the production function for life expectancy with N equal to 2. Label the curve "L'." Carefully follow the instructions above, and only draw the required objects. Now supose that N = 1 and H= 4. (Assume c continues to equal 2.) You run a charity that can provide either food aid or health aid to this country. Which would provide the greater benefit, ncreasing H by 1 or N by 1? Greater benefits would be provided by increasing expenditures on by 1