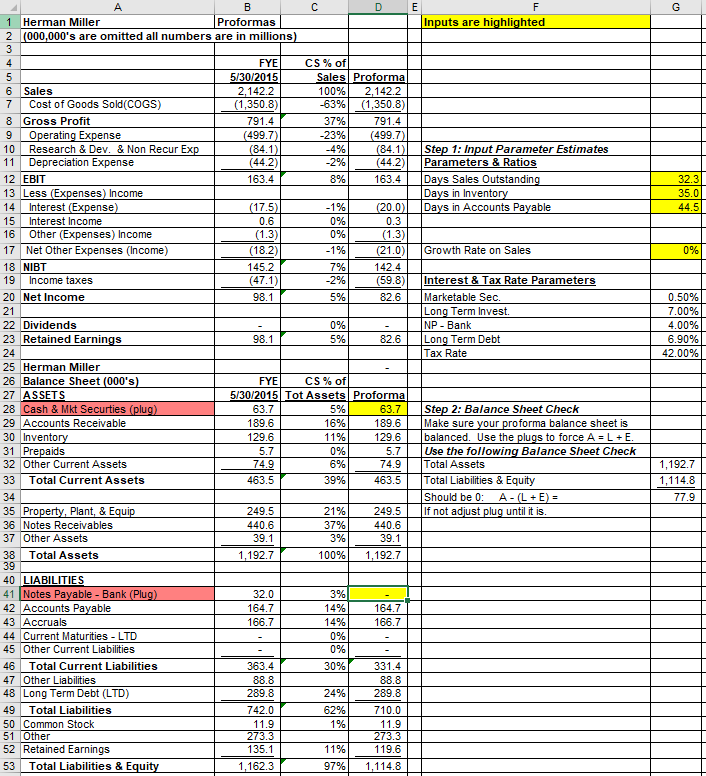
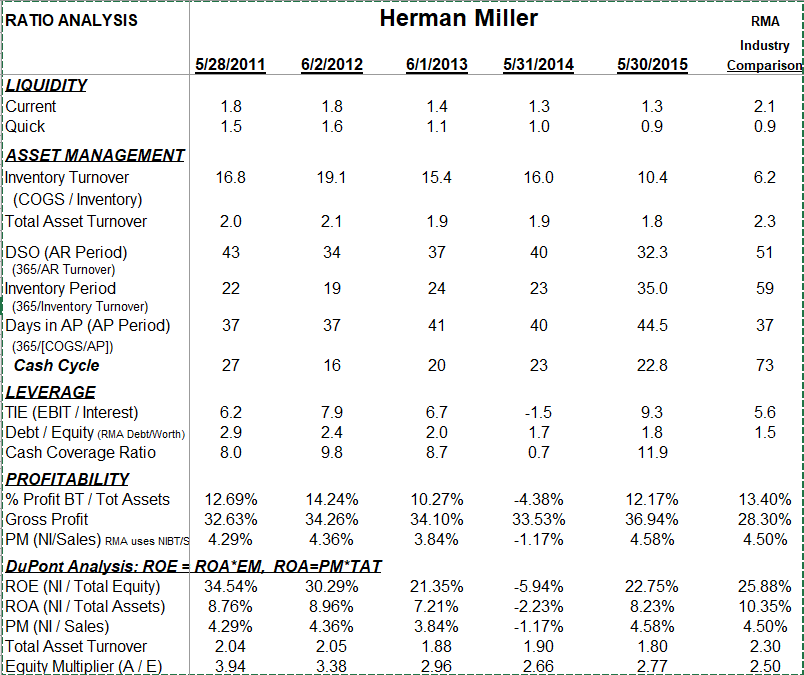
Suppose MLHR Days Payable is at the same level as the prior year. Use the proforma sheet to indicate the impact on the financial statements assuming Days Sales Outstanding and Days in Inventory both double, causing the operating cycle to double in length. What is the new plug figure to make the balance sheet balance? State answer omitting the last 000,000's consistent with proforma. (Note one plug is always zero for cells D28 and D41 on the Proforma Spreadsheet)
| a. Cash & Marketable Securities = | |
| b. Notes Payable Bank = | |
Using the same parameters, what is the proforma Net Income (Loss) (omitting 000,000's)?


G 32.3 35.0 44.5 0% 0.50% 7.00% 4.00% 6.90% 42.00% i A B D E F 1 Herman Miller Proformas Inputs are highlighted 2 (000,000's are omitted all numbers are in millions) 3 4 FYE CS% of 5 5/30/2015 Sales Proforma 6 Sales 2,142.2 100% 2,142.2 7 Cost of Goods Sold (COGS) (1,350.8) -63% (1,350.8) 8 Gross Profit 791.4 37% 791.4 9 Operating Expense (499.7) -23% (499.7) 10 Research & Dev. & Non Recur Exp (84.1) -4% (84.1) Step 1: Input Parameter Estimates 11 Depreciation Expense (44.2) -2% (44.2) Parameters & Ratios 12 EBIT 163.4 8% 163.4 Days Sales Outstanding 13 Less (Expenses) Income Days in Inventory 14 Interest (Expense) (17.5) -1% (20.0) Days in Accounts Payable 15 Interest Income 0.6 0% 0.3 16 Other (Expenses) Income (1.3) 0% (1.3) 17 Net Other Expenses (Income) (18.2) -1% (21.0) Growth Rate on Sales 18 NIBT 145.2 7% 142.4 19 Income taxes (47.1) -2% (59.8) Interest & Tax Rate Parameters 20 Net Income 98.1 5% 82.6 Marketable Sec. 21 Long Term Invest. 22 Dividends 0% NP-Bank 23 Retained Earnings 98.1 5% 82.6 Long Term Debt 24 Tax Rate 25 Herman Miller 26 Balance Sheet (000's) FYE CS% of 27 ASSETS 5/30/2015 Tot Assets Proforma 28 Cash & Mkt Securties (plug) 63.7 5% 63.7 Step 2: Balance Sheet Check 29 Accounts Receivable 189.6 16% 189.6 Make sure your proforma balance sheet is 30 Inventory 129.6 11% 129.6 balanced. Use the plugs force A = L + E. 31 Prepaids 5.7 0% 5.7 Use the following Balance Sheet Check 32 Other Current Assets 74.9 6% 74.9 Total Assets 33 Total Current Assets 463.5 39% 463.5 Total Liabilities & Equity 34 Should be 0: A - (L + E) = 35 Property, Plant, & Equip 249.5 21% 249.5 If not adjust plug until it is. 36 Notes Receivables 440.6 37% 440.6 37 Other Assets 39.1 3% 39.1 38 Total Assets 1,192.7 100% 1,192.7 39 40 LIABILITIES 41 Notes Payable - Bank (Plug) 32.0 3% 42 Accounts Payable 164.7 14% 164.7 43 Accruals 166.7 14% 166.7 44 Current Maturities - LTD 45 Other Current Liabilities 0% 46 Total Current Liabilities 363.4 30% 331.4 47 Other Liabilities 88.8 88.8 48 Long Term Debt (LTD) 289.8 24% 289.8 49 Total Liabilities 742.0 62% 710.0 50 Common Stock 11.9 1% 11.9 51 Other 273.3 273.3 52 Retained Earnings 135.1 11% 119.6 53 Total Liabilities & Equity 1,162.3 97% 1,114.8 1,192.7 1,114.8 77.9 0% RATIO ANALYSIS Herman Miller RMA 6/1/2013 5/31/2014 5/30/2015 Industry Comparison 1.4 1.1 1.3 1.0 1.3 0.9 2.1 0.9 15.4 16.0 10.4 6.2 1.9 1.9 1.8 2.3 37 40 32.3 51 24 23 35.0 59 41 40 44.5 37 5/28/2011 6/2/2012 LIQUIDITY Current 1.8 1.8 Quick 1.5 1.6 ASSET MANAGEMENT Inventory Turnover 16.8 19.1 (COGS / Inventory) Total Asset Turnover 2.0 2.1 DSO (AR Period) 43 34 (365/AR Turnover) Inventory Period 22 19 (365/Inventory Turnover) Days in AP (AP Period) 37 37 (365/[COGS/AP]) Cash Cycle 27 16 LEVERAGE TIE (EBIT / Interest) 6.2 7.9 Debt / Equity (RMA Debt/Worth) 2.9 2.4 Cash Coverage Ratio 8.0 9.8 PROFITABILITY % Profit BT / Tot Assets 12.69% 14.24% Gross Profit 32.63% 34.26% PM (NI/Sales) RMA USES NIBTIS 4.29% 4.36% DuPont Analysis: ROE - ROA EM. ROA=PM'TAT ROE (NI / Total Equity) 34.54% 30.29% ROA (NI / Total Assets) 8.76% 8.96% JPM (NI / Sales) 4.29% 4.36% Total Asset Turnover 2.04 2.05 Equity Multiplier (A/E) 3.94 3.38 20 23 22.8 73 6.7 2.0 8.7 -1.5 1.7 0.7 9.3 1.8 11.9 5.6 1.5 10.27% 34.10% 3.84% 4.38% 33.53% -1.17% 12.17% 36.94% 4.58% 13.40% 28.30% 4.50% 21.35% 7.21% 3.84% 1.88 2.96 -5.94% -2.23% - 1.17% 1.90 2.66 22.75% 8.23% 4.58% 1.80 2.77 25.88% 10.35% 4.50% 2.30 2.50 G 32.3 35.0 44.5 0% 0.50% 7.00% 4.00% 6.90% 42.00% i A B D E F 1 Herman Miller Proformas Inputs are highlighted 2 (000,000's are omitted all numbers are in millions) 3 4 FYE CS% of 5 5/30/2015 Sales Proforma 6 Sales 2,142.2 100% 2,142.2 7 Cost of Goods Sold (COGS) (1,350.8) -63% (1,350.8) 8 Gross Profit 791.4 37% 791.4 9 Operating Expense (499.7) -23% (499.7) 10 Research & Dev. & Non Recur Exp (84.1) -4% (84.1) Step 1: Input Parameter Estimates 11 Depreciation Expense (44.2) -2% (44.2) Parameters & Ratios 12 EBIT 163.4 8% 163.4 Days Sales Outstanding 13 Less (Expenses) Income Days in Inventory 14 Interest (Expense) (17.5) -1% (20.0) Days in Accounts Payable 15 Interest Income 0.6 0% 0.3 16 Other (Expenses) Income (1.3) 0% (1.3) 17 Net Other Expenses (Income) (18.2) -1% (21.0) Growth Rate on Sales 18 NIBT 145.2 7% 142.4 19 Income taxes (47.1) -2% (59.8) Interest & Tax Rate Parameters 20 Net Income 98.1 5% 82.6 Marketable Sec. 21 Long Term Invest. 22 Dividends 0% NP-Bank 23 Retained Earnings 98.1 5% 82.6 Long Term Debt 24 Tax Rate 25 Herman Miller 26 Balance Sheet (000's) FYE CS% of 27 ASSETS 5/30/2015 Tot Assets Proforma 28 Cash & Mkt Securties (plug) 63.7 5% 63.7 Step 2: Balance Sheet Check 29 Accounts Receivable 189.6 16% 189.6 Make sure your proforma balance sheet is 30 Inventory 129.6 11% 129.6 balanced. Use the plugs force A = L + E. 31 Prepaids 5.7 0% 5.7 Use the following Balance Sheet Check 32 Other Current Assets 74.9 6% 74.9 Total Assets 33 Total Current Assets 463.5 39% 463.5 Total Liabilities & Equity 34 Should be 0: A - (L + E) = 35 Property, Plant, & Equip 249.5 21% 249.5 If not adjust plug until it is. 36 Notes Receivables 440.6 37% 440.6 37 Other Assets 39.1 3% 39.1 38 Total Assets 1,192.7 100% 1,192.7 39 40 LIABILITIES 41 Notes Payable - Bank (Plug) 32.0 3% 42 Accounts Payable 164.7 14% 164.7 43 Accruals 166.7 14% 166.7 44 Current Maturities - LTD 45 Other Current Liabilities 0% 46 Total Current Liabilities 363.4 30% 331.4 47 Other Liabilities 88.8 88.8 48 Long Term Debt (LTD) 289.8 24% 289.8 49 Total Liabilities 742.0 62% 710.0 50 Common Stock 11.9 1% 11.9 51 Other 273.3 273.3 52 Retained Earnings 135.1 11% 119.6 53 Total Liabilities & Equity 1,162.3 97% 1,114.8 1,192.7 1,114.8 77.9 0% RATIO ANALYSIS Herman Miller RMA 6/1/2013 5/31/2014 5/30/2015 Industry Comparison 1.4 1.1 1.3 1.0 1.3 0.9 2.1 0.9 15.4 16.0 10.4 6.2 1.9 1.9 1.8 2.3 37 40 32.3 51 24 23 35.0 59 41 40 44.5 37 5/28/2011 6/2/2012 LIQUIDITY Current 1.8 1.8 Quick 1.5 1.6 ASSET MANAGEMENT Inventory Turnover 16.8 19.1 (COGS / Inventory) Total Asset Turnover 2.0 2.1 DSO (AR Period) 43 34 (365/AR Turnover) Inventory Period 22 19 (365/Inventory Turnover) Days in AP (AP Period) 37 37 (365/[COGS/AP]) Cash Cycle 27 16 LEVERAGE TIE (EBIT / Interest) 6.2 7.9 Debt / Equity (RMA Debt/Worth) 2.9 2.4 Cash Coverage Ratio 8.0 9.8 PROFITABILITY % Profit BT / Tot Assets 12.69% 14.24% Gross Profit 32.63% 34.26% PM (NI/Sales) RMA USES NIBTIS 4.29% 4.36% DuPont Analysis: ROE - ROA EM. ROA=PM'TAT ROE (NI / Total Equity) 34.54% 30.29% ROA (NI / Total Assets) 8.76% 8.96% JPM (NI / Sales) 4.29% 4.36% Total Asset Turnover 2.04 2.05 Equity Multiplier (A/E) 3.94 3.38 20 23 22.8 73 6.7 2.0 8.7 -1.5 1.7 0.7 9.3 1.8 11.9 5.6 1.5 10.27% 34.10% 3.84% 4.38% 33.53% -1.17% 12.17% 36.94% 4.58% 13.40% 28.30% 4.50% 21.35% 7.21% 3.84% 1.88 2.96 -5.94% -2.23% - 1.17% 1.90 2.66 22.75% 8.23% 4.58% 1.80 2.77 25.88% 10.35% 4.50% 2.30 2.50


