Answered step by step
Verified Expert Solution
Question
1 Approved Answer
Suppose that a U.S. state decides to build some new schools in 2025. It does not have enough money to build a new school

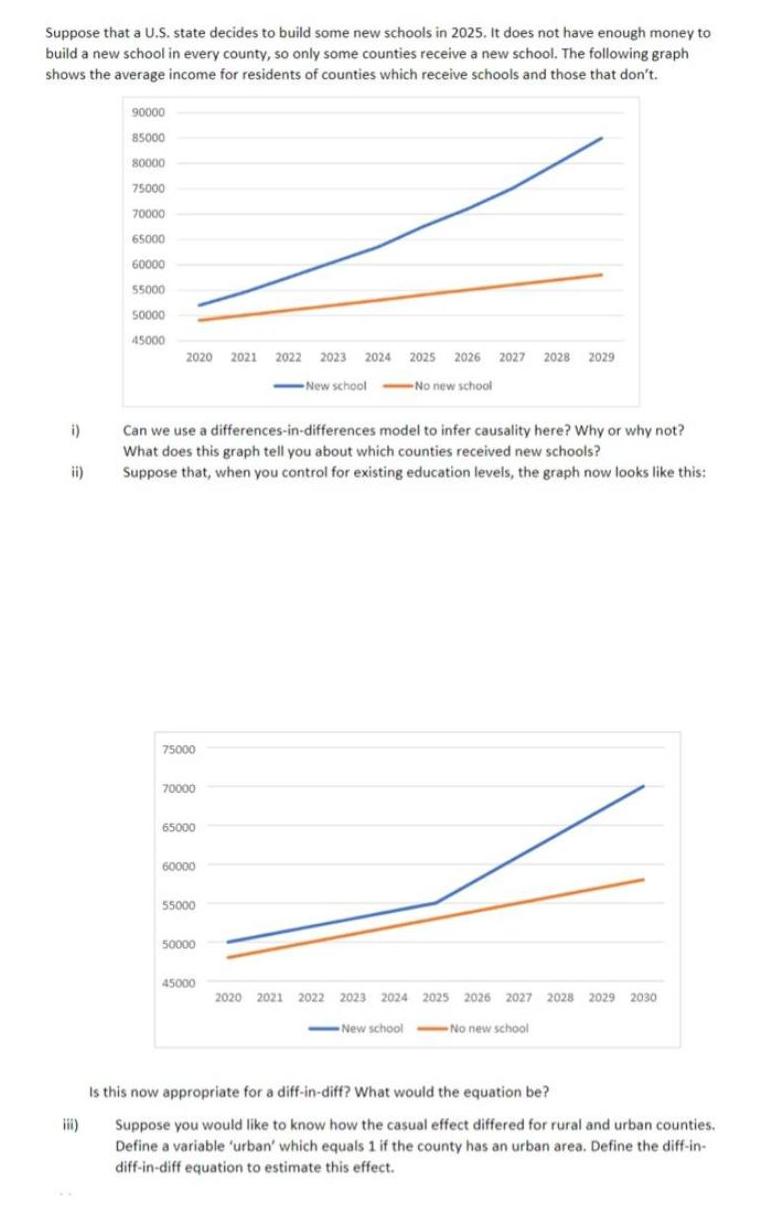
Suppose that a U.S. state decides to build some new schools in 2025. It does not have enough money to build a new school in every county, so only some counties receive a new school. The following graph shows the average income for residents of counties which receive schools and those that don't. i) ii) iii) 90000 85000 80000 75000 70000 65000 60000 55000 50000 45000 2020 2021 2022 2023 2024 2025 2026 2027 2028 2029 -New school-No new school Can we use a differences-in-differences model to infer causality here? Why or why not? What does this graph tell you about which counties received new schools? Suppose that, when you control for existing education levels, the graph now looks like this: 75000 70000 65000 60000 55000 50000 45000 2020 2021 2022 2023 2024 2025 2026 2027 2028 2029 2030 -New school No new school Is this now appropriate for a diff-in-diff? What would the equation be? Suppose you would like to know how the casual effect differed for rural and urban counties. Define a variable 'urban' which equals 1 if the county has an urban area. Define the diff-in- diff-in-diff equation to estimate this effect.
Step by Step Solution
★★★★★
3.51 Rating (154 Votes )
There are 3 Steps involved in it
Step: 1
Can a DifferenceinDifferences Model be Used Here i No the current graph is not suitable for a differencesindifferences DID model to infer causality fo...
Get Instant Access to Expert-Tailored Solutions
See step-by-step solutions with expert insights and AI powered tools for academic success
Step: 2

Step: 3

Ace Your Homework with AI
Get the answers you need in no time with our AI-driven, step-by-step assistance
Get Started


