Answered step by step
Verified Expert Solution
Link Copied!

Question

1 Approved Answer

Suppose that all the response and explanatory variables have been appropriately trans- formed. Let Y denote the transformed response variable; let Z1, Z2, Z3, Z4
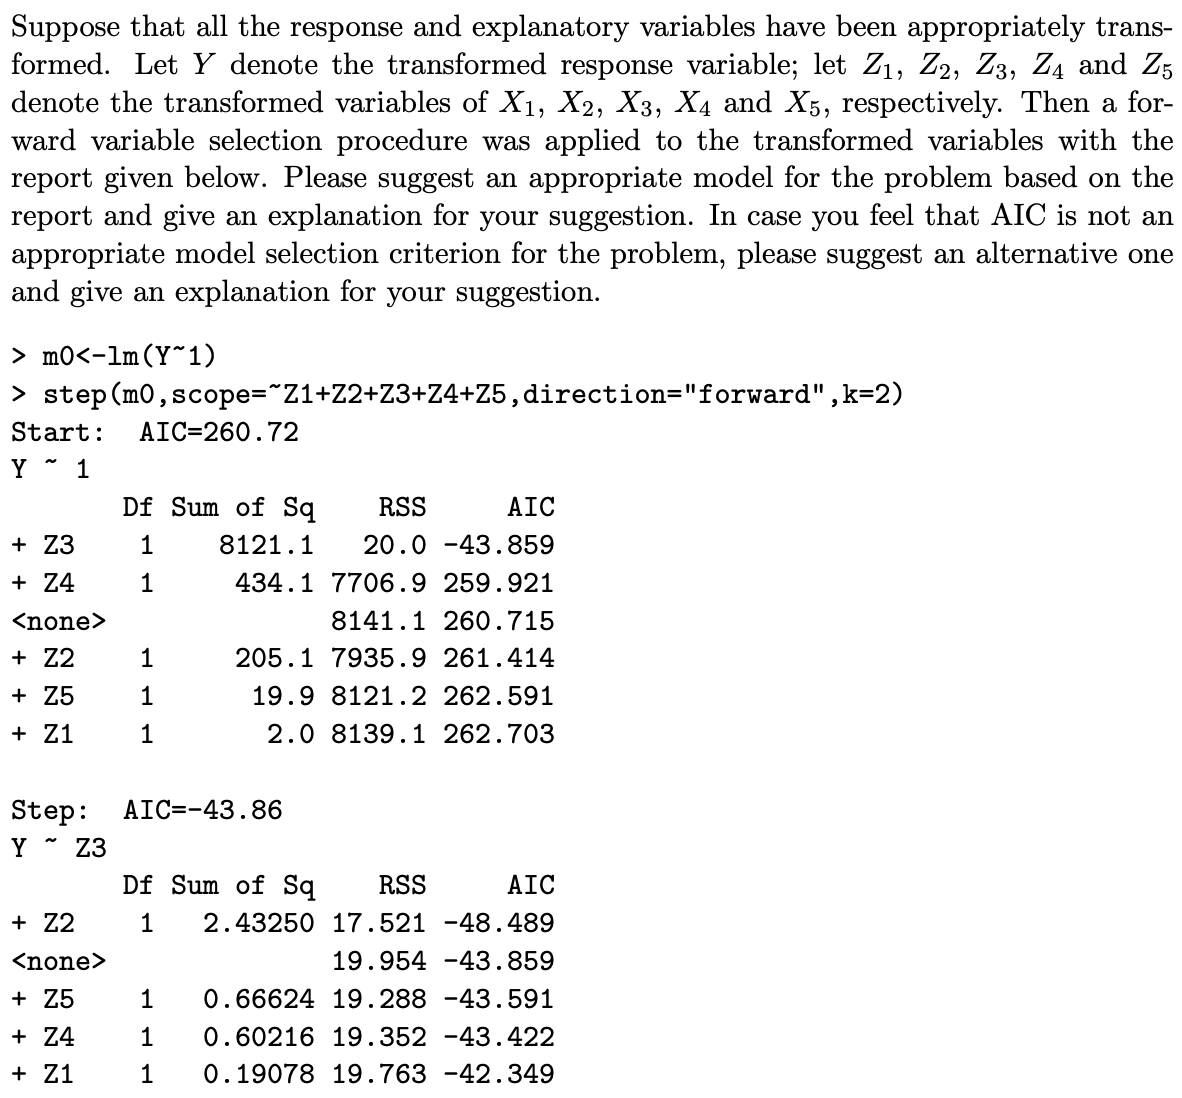
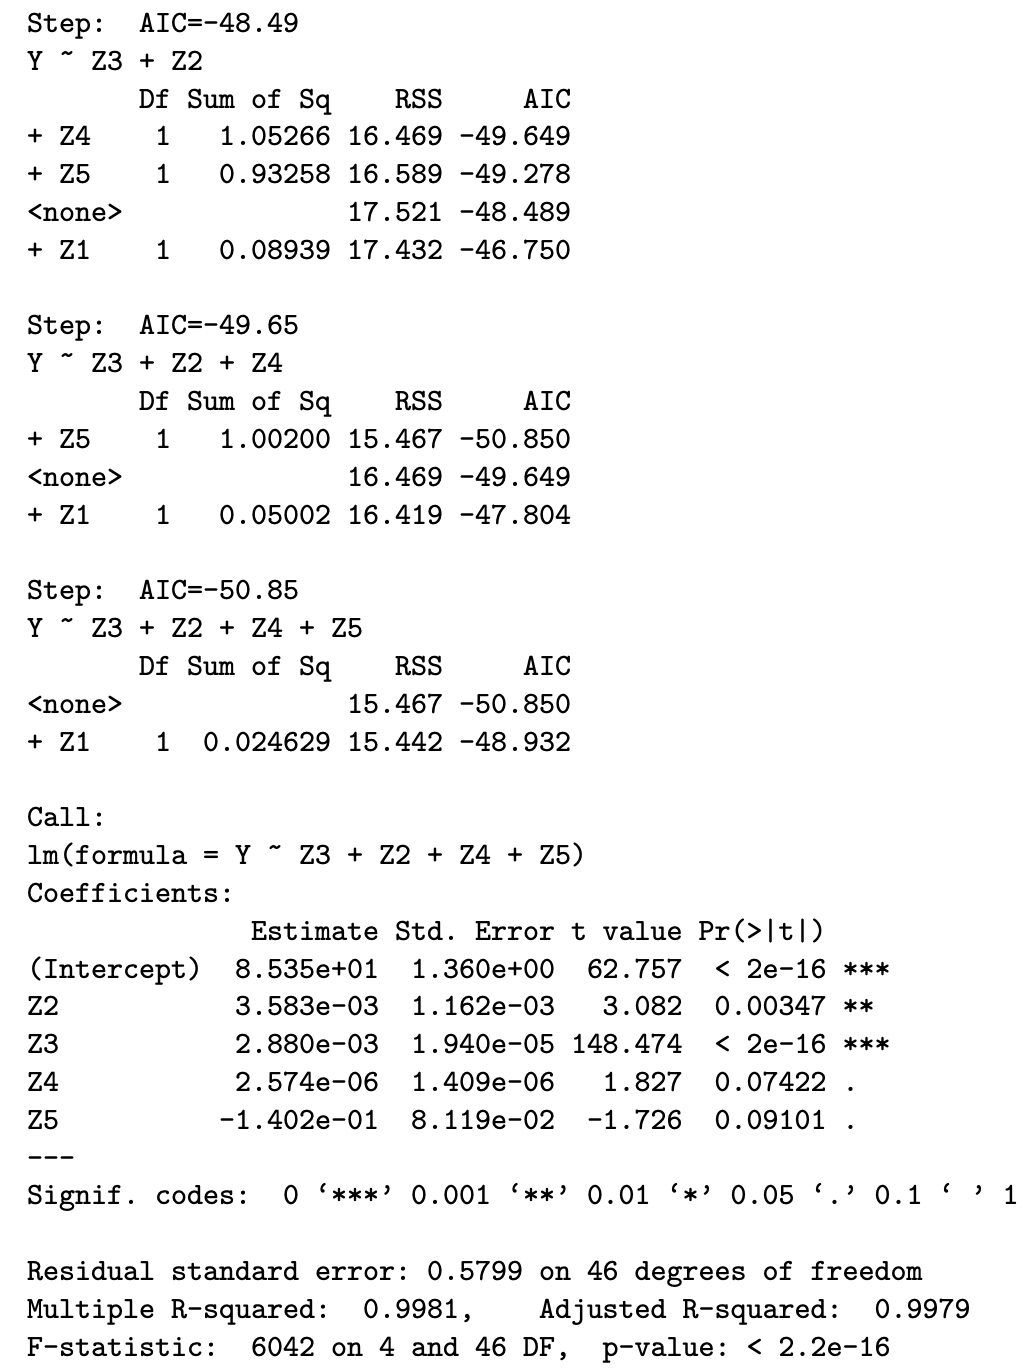
image text in transcribedimage text in transcribed
Suppose that all the response and explanatory variables have been appropriately trans- formed. Let Y denote the transformed response variable; let Z1, Z2, Z3, Z4 and Z5 denote the transformed variables of X1, X2, X3, X4 and X5, respectively. Then a for- ward variable selection procedure was applied to the transformed variables with the report given below. Please suggest an appropriate model for the problem based on the report and give an explanation for your suggestion. In case you feel that AIC is not an appropriate model selection criterion for the problem, please suggest an alternative one and give an explanation for your suggestion. > m0 step (m0 , scope=\"21+22+23+24+25 , direct ion= "forward " , k=2) Start: AIC=260.72 Y " 1 Df Sum of Sq RSS AIC + Z3 1 8121.1 20.0 -43.859 + Z4 1 434.1 7706.9 259.921 8141.1 260.715 + 22 1 205.1 7935.9 261.414 + 25 1 19.9 8121.2 262.591 + 21 1 2.0 8139.1 262.703 Step: AIC=-43.86 Y " 23 Df Sum of Sq RSS AIC + 22 1 2.43250 17.521 -48.489 19.954 -43.859 + 25 1 0.66624 19.288 -43.591 + 24 1 0.60216 19.352 -43.422 + 21 1 0.19078 19.763 -42.349 Step: AIC=-48 . 49 Y ~ Z3 + Z2 Df Sum of Sq RSS AIC + Z4 1. 05266 16.469 -49.649 + 25 1 0. 93258 16.589 -49.278 17. 521 -48.489 + Z1 0. 08939 17. 432 -46.750 Step: AIC=-49. 65 Y ~ Z3 + Z2 + Z4 Df Sum of Sq RSS AIC 25 1 1. 00200 15. 467 -50.850 16. 469 -49. 649 + Z1 1 0. 05002 16. 419 -47.804 Step: AIC=-50. 85 Y ~ Z3 + Z2 + 24 + 25 Df Sum of Sq RSS AIC 15. 467 -50.850 + Z1 1 0. 024629 15.442 -48.932 Call : Im (formula = Y ~ Z3 + Z2 + Z4 + 25) Coefficients: Estimate Std. Error t value Pr(> It|) (Intercept) 8.535e+01 1.360e+00 62.757 1 Residual standard error: 0.5799 on 46 degrees of freedom Multiple R-squared: 0.9981, Adjusted R-squared: 0.9979 F-statistic: 6042 on 4 and 46 DF, p-value:

Step by Step Solution

There are 3 Steps involved in it

Step: 1

blur-text-image

Get Instant Access to Expert-Tailored Solutions

See step-by-step solutions with expert insights and AI powered tools for academic success

Step: 2

blur-text-image_2

Step: 3

blur-text-image_3

Ace Your Homework with AI

Get the answers you need in no time with our AI-driven, step-by-step assistance

Get Started

Recommended Textbook for

Introduction to graph theory

Authors: Douglas B. West

2nd edition

131437372, 978-0131437371

More Books

Students also viewed these Mathematics questions

Question

What are the stages of project management? Write it in items.

Answered: 1 week ago