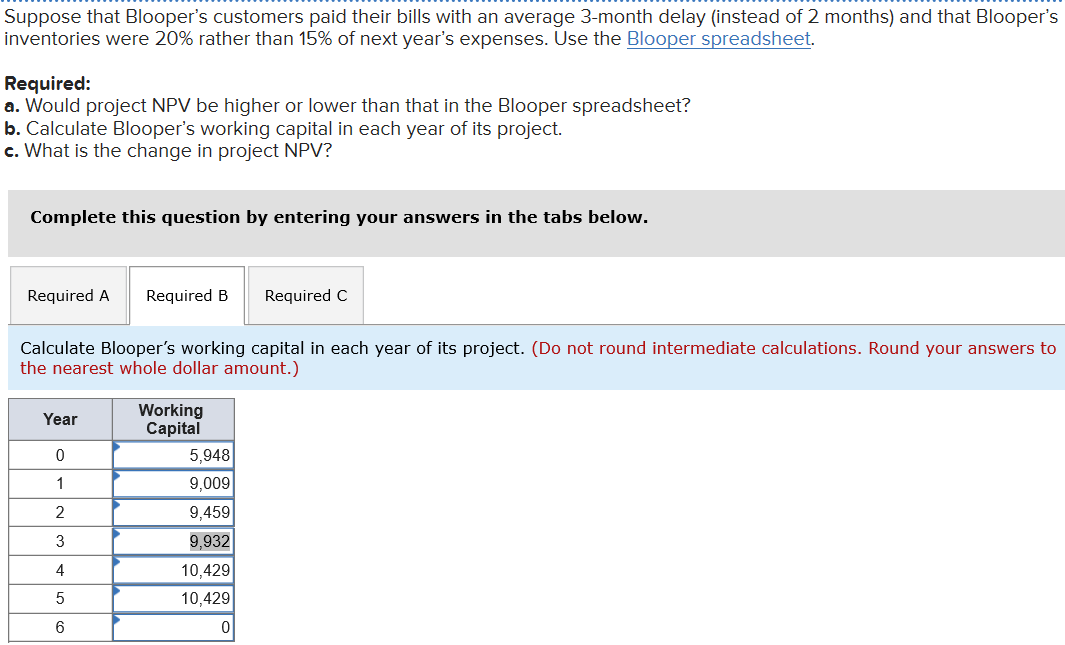
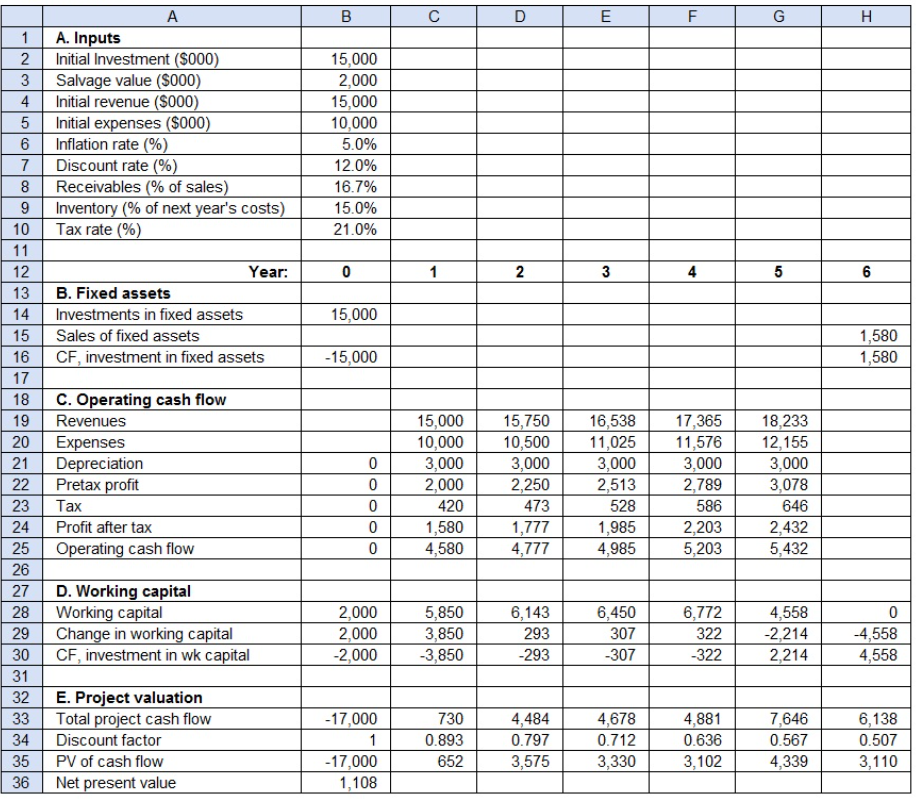
Suppose that Blooper's customers paid their bills with an average 3-month delay (instead of 2 months) and that Blooper's inventories were 20% rather than 15% of next year's expenses. Use the Blooper spreadsheet. Required: a. Would project NPV be higher or lower than that in the Blooper spreadsheet? b. Calculate Blooper's working capital in each year of its project. c. What is the change in project NPV? Complete this question by entering your answers in the tabs below. Required A Required B Required C Calculate Blooper's working capital in each year of its project. (Do not round intermediate calculations. Round your answers to the nearest whole dollar amount.) Year 2 3 4 Working Capital 5,948 9,009 9,459 9,932 10,429 10,429 B C E 1 2 3 4 5 A. Inputs Initial Investment ($000) Salvage value (5000) Initial revenue ($000) Initial expenses ($000) Inflation rate (%) Discount rate (%) Receivables (% of sales) Inventory (% of next year's costs) Tax rate (%) 6 15.000 2.000 15,000 10,000 5.0% 12.0% 16.7% 15.0% 21.0% 7 8 0 Year: B. Fixed assets Investments in fixed assets Sales of fixed assets C F, investment in fixed assets 15,000 1,580 1,580 -15,000 | 10 11 12 13 14 15 16 17 18 19 20 21 22 23 24 25 26 27 28 29 30 31 32 33 34 35 36 C. Operating cash flow Revenues Expenses Depreciation Pretax profit Tax Profit after tax Operating cash flow O 0 0 15,000 10,000 3.000 2.000 420 1.580 4,580 10,500 3,000 2,250 473 1,777 4,777 16,538 11,025 3,000 2,513 5 28 1,985 4,985 17,365 11,576 3,000 2,789 586 2,203 5,203 18,233 12, 155 3.000 3,078 646 2,432 5,432 0 6.772 D. Working capital Working capital Change in working capital CF, investment in wk capital 2.000 2,000 -2,000 5,850 3,850 3,850 6,143 293 -293 6.450 307 -307 322 -322 4.558 -2,214 2,214 -4,558 4,558 -17,000 730 E. Project valuation Total project cash flow Discount factor PV of cash flow Net present value 0.893 652 4,484 0.797 3,575 4,678 0.712 3,330 4,881 0.636 3,102 7,646 0.567 4,339 6,138 0.507 3,110 -17,000 1,108 Suppose that Blooper's customers paid their bills with an average 3-month delay (instead of 2 months) and that Blooper's inventories were 20% rather than 15% of next year's expenses. Use the Blooper spreadsheet. Required: a. Would project NPV be higher or lower than that in the Blooper spreadsheet? b. Calculate Blooper's working capital in each year of its project. c. What is the change in project NPV? Complete this question by entering your answers in the tabs below. Required A Required B Required C Calculate Blooper's working capital in each year of its project. (Do not round intermediate calculations. Round your answers to the nearest whole dollar amount.) Year 2 3 4 Working Capital 5,948 9,009 9,459 9,932 10,429 10,429 B C E 1 2 3 4 5 A. Inputs Initial Investment ($000) Salvage value (5000) Initial revenue ($000) Initial expenses ($000) Inflation rate (%) Discount rate (%) Receivables (% of sales) Inventory (% of next year's costs) Tax rate (%) 6 15.000 2.000 15,000 10,000 5.0% 12.0% 16.7% 15.0% 21.0% 7 8 0 Year: B. Fixed assets Investments in fixed assets Sales of fixed assets C F, investment in fixed assets 15,000 1,580 1,580 -15,000 | 10 11 12 13 14 15 16 17 18 19 20 21 22 23 24 25 26 27 28 29 30 31 32 33 34 35 36 C. Operating cash flow Revenues Expenses Depreciation Pretax profit Tax Profit after tax Operating cash flow O 0 0 15,000 10,000 3.000 2.000 420 1.580 4,580 10,500 3,000 2,250 473 1,777 4,777 16,538 11,025 3,000 2,513 5 28 1,985 4,985 17,365 11,576 3,000 2,789 586 2,203 5,203 18,233 12, 155 3.000 3,078 646 2,432 5,432 0 6.772 D. Working capital Working capital Change in working capital CF, investment in wk capital 2.000 2,000 -2,000 5,850 3,850 3,850 6,143 293 -293 6.450 307 -307 322 -322 4.558 -2,214 2,214 -4,558 4,558 -17,000 730 E. Project valuation Total project cash flow Discount factor PV of cash flow Net present value 0.893 652 4,484 0.797 3,575 4,678 0.712 3,330 4,881 0.636 3,102 7,646 0.567 4,339 6,138 0.507 3,110 -17,000 1,108