Suppose that Bloopers customers paid their bills with an average 3-month delay (instead of 2 months) and that Bloopers inventories were 20% rather than 15% of next years expenses. Use the Blooper spreadsheet.
Required:
a. Would project NPV be higher or lower than that in the Blooper spreadsheet?
b. Calculate Bloopers working capital in each year of its project.
c. What is the change in project NPV?
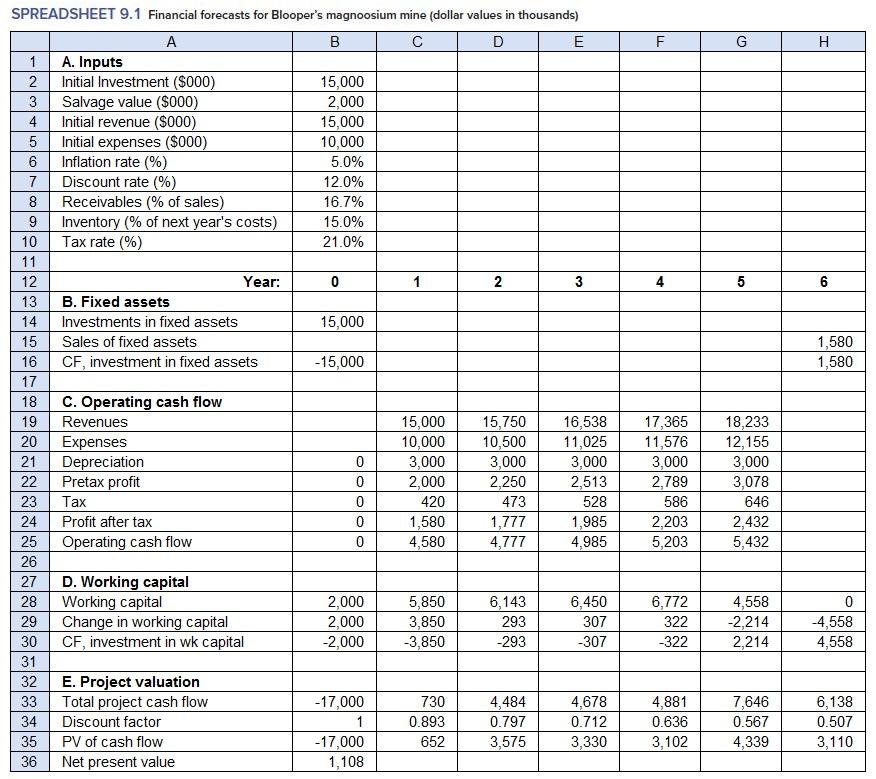
F G H 4 5 6 1,580 1,580 SPREADSHEET 9.1 Financial forecasts for Blooper's magnoosium mine (dollar values in thousands) A B D E 1 A. Inputs 2 Initial Investment ($000) 15,000 3 Salvage value ($000) 2,000 4 Initial revenue ($000) 15,000 5 Initial expenses ($000) 10,000 6 Inflation rate (%) 5.0% 7 Discount rate (%) 12.0% 8 Receivables (% of sales) 16.7% 9 Inventory (% of next year's costs) 15.0% 10 Tax rate (%) 21.0% 11 12 Year: 0 1 2 3 13 B. Fixed assets 14 Investments in fixed assets 15,000 15 Sales of fixed assets 16 CF, investment in fixed assets -15,000 17 18 C. Operating cash flow 19 Revenues 15,000 15,750 16,538 20 Expenses 10,000 10,500 11,025 21 Depreciation 0 3,000 3,000 3,000 22 Pretax profit 0 2,000 2,250 2,513 23 Tax 0 420 473 528 24 Profit after tax 0 1,580 1,777 1,985 25 Operating cash flow 0 4,580 4,777 4,985 26 27 D. Working capital 28 Working capital 2,000 5,850 6,143 6,450 29 Change in working capital 2,000 3,850 293 307 30 CF, investment in wk capital -2,000 -3,850 -293 -307 31 32 E. Project valuation 33 Total project cash flow -17,000 730 4,484 4,678 34 Discount factor 1 0.893 0.797 0.712 35 PV of cash flow -17,000 652 3,575 3,330 36 Net present value 1,108 17,365 11,576 3,000 2,789 586 2,203 5,203 18,233 12,155 3,000 3,078 646 2,432 5,432 6,772 322 -322 4,558 -2,214 2,214 0 -4,558 4,558 4,881 0.636 3,102 7,646 0.567 4,339 6,138 0.507 3,110 F G H 4 5 6 1,580 1,580 SPREADSHEET 9.1 Financial forecasts for Blooper's magnoosium mine (dollar values in thousands) A B D E 1 A. Inputs 2 Initial Investment ($000) 15,000 3 Salvage value ($000) 2,000 4 Initial revenue ($000) 15,000 5 Initial expenses ($000) 10,000 6 Inflation rate (%) 5.0% 7 Discount rate (%) 12.0% 8 Receivables (% of sales) 16.7% 9 Inventory (% of next year's costs) 15.0% 10 Tax rate (%) 21.0% 11 12 Year: 0 1 2 3 13 B. Fixed assets 14 Investments in fixed assets 15,000 15 Sales of fixed assets 16 CF, investment in fixed assets -15,000 17 18 C. Operating cash flow 19 Revenues 15,000 15,750 16,538 20 Expenses 10,000 10,500 11,025 21 Depreciation 0 3,000 3,000 3,000 22 Pretax profit 0 2,000 2,250 2,513 23 Tax 0 420 473 528 24 Profit after tax 0 1,580 1,777 1,985 25 Operating cash flow 0 4,580 4,777 4,985 26 27 D. Working capital 28 Working capital 2,000 5,850 6,143 6,450 29 Change in working capital 2,000 3,850 293 307 30 CF, investment in wk capital -2,000 -3,850 -293 -307 31 32 E. Project valuation 33 Total project cash flow -17,000 730 4,484 4,678 34 Discount factor 1 0.893 0.797 0.712 35 PV of cash flow -17,000 652 3,575 3,330 36 Net present value 1,108 17,365 11,576 3,000 2,789 586 2,203 5,203 18,233 12,155 3,000 3,078 646 2,432 5,432 6,772 322 -322 4,558 -2,214 2,214 0 -4,558 4,558 4,881 0.636 3,102 7,646 0.567 4,339 6,138 0.507 3,110