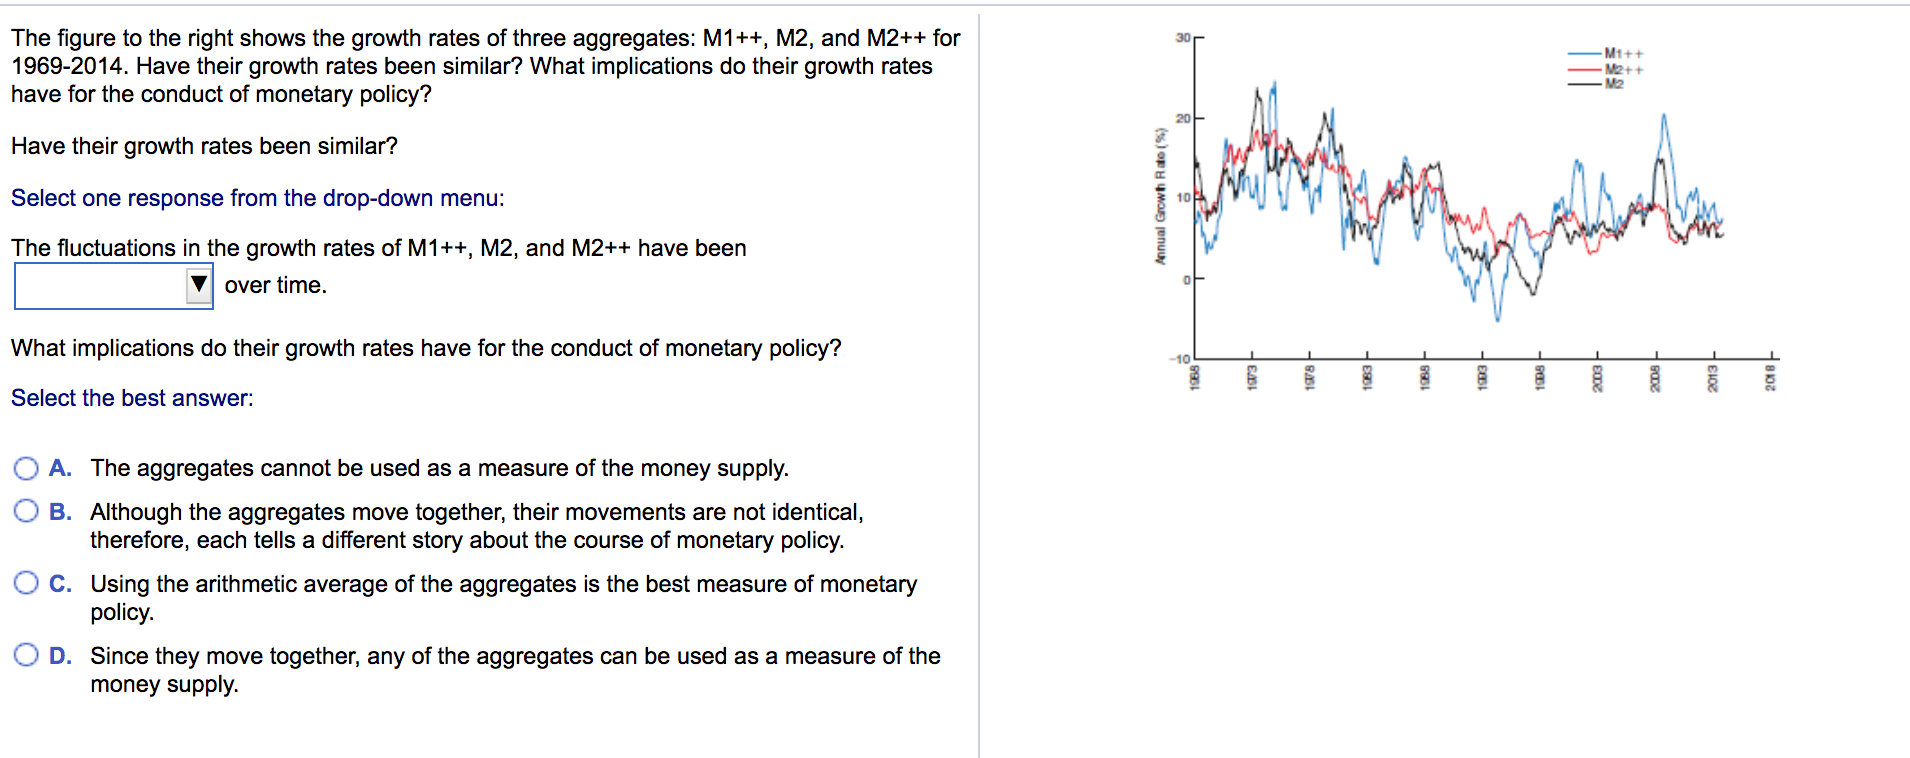

Suppose that in a certain month, the year-over-year growth rate of M1 in the United States fell to 6.1%, while the growth rate of M2 rose to 10.7%. A few years later, the year-over-year growth rate of the M1 money supply was 6.5%, while the growth rate of the M2 money supply was about 9.2%. How should Federal Reserve policymakers interpret these changes in the growth rates of M1 and M2? (Select all that apply.) A. Americans must be holding more currency outside of banks. B. The growth rates of M1 and M2 moved in opposite directions. C. In this period, different courses of monetary policy action might be deemed appropriate depending on what measure of money is used. D. The Federal Reserve's methods of measuring money supply growth are most likely flawed in some way, since it is nearly impossible for both of these changes to happen at the same time. E. The United States economy must be experiencing hyperinflation. 30 The figure to the right shows the growth rates of three aggregates: M1++, M2, and M2++ for 1969-2014. Have their growth rates been similar? What implications do their growth rates have for the conduct of monetary policy? M1++ M2+ + M2 Have their growth rates been similar? Select one response from the drop-down menu: Annual Growh Rao (9) The fluctuations in the growth rates of M1++, M2, and M2++ have been over time. What implications do their growth rates have for the conduct of monetary policy? -10 1968 1673 168 B3 189 Em emme HELOR 2018 Select the best answer: A. The aggregates cannot be used as a measure of the money supply. B. Although the aggregates move together, their movements are not identical, therefore, each tells a different story about the course of monetary policy. C. Using the arithmetic average of the aggregates is the best measure of monetary policy. D. Since they move together, any of the aggregates can be used as a measure of the money supply. Suppose that in a certain month, the year-over-year growth rate of M1 in the United States fell to 6.1%, while the growth rate of M2 rose to 10.7%. A few years later, the year-over-year growth rate of the M1 money supply was 6.5%, while the growth rate of the M2 money supply was about 9.2%. How should Federal Reserve policymakers interpret these changes in the growth rates of M1 and M2? (Select all that apply.) A. Americans must be holding more currency outside of banks. B. The growth rates of M1 and M2 moved in opposite directions. C. In this period, different courses of monetary policy action might be deemed appropriate depending on what measure of money is used. D. The Federal Reserve's methods of measuring money supply growth are most likely flawed in some way, since it is nearly impossible for both of these changes to happen at the same time. E. The United States economy must be experiencing hyperinflation. 30 The figure to the right shows the growth rates of three aggregates: M1++, M2, and M2++ for 1969-2014. Have their growth rates been similar? What implications do their growth rates have for the conduct of monetary policy? M1++ M2+ + M2 Have their growth rates been similar? Select one response from the drop-down menu: Annual Growh Rao (9) The fluctuations in the growth rates of M1++, M2, and M2++ have been over time. What implications do their growth rates have for the conduct of monetary policy? -10 1968 1673 168 B3 189 Em emme HELOR 2018 Select the best answer: A. The aggregates cannot be used as a measure of the money supply. B. Although the aggregates move together, their movements are not identical, therefore, each tells a different story about the course of monetary policy. C. Using the arithmetic average of the aggregates is the best measure of monetary policy. D. Since they move together, any of the aggregates can be used as a measure of the money supply


