

Question
Suppose that in December the demand of mandarin oranges increases by 375 while the supply increases by 150. a) Draw the new curves D2
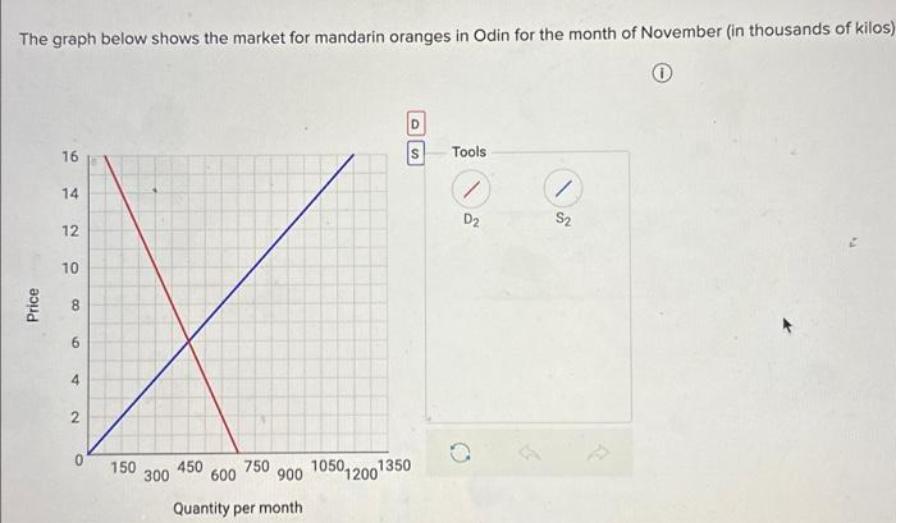
Suppose that in December the demand of mandarin oranges increases by 375 while the supply increases by 150. a) Draw the new curves D2 and S2 in graph above. Plot only the endpoints of the curve above and position those points on the edges of the graphing area. b) What will be the new equilibrium price and quantity? Equilibrium price: $[ Equilibrium quantity The graph below shows the market for mandarin oranges in Odin for the month of November (in thousands of kilos) 0 Price 16 14 12 10 8 6 4 2 0 150 300 450 600 900 105012001350 750 Quantity per month Tools / D S2
Step by Step Solution
3.37 Rating (126 Votes )
There are 3 Steps involved in it
Step: 1

Get Instant Access with AI-Powered Solutions
See step-by-step solutions with expert insights and AI powered tools for academic success
Step: 2

Step: 3
Ace Your Homework with AI
Get the answers you need in no time with our AI-driven, step-by-step assistance
Get Started
Macroeconomics Principles Applications And Tools
Authors: Arthur O Sullivan, Steven M. Sheffrin, Stephen J. Perez
7th Edition
978-0134089034, 9780134062754, 134089030, 134062752, 978-0132555234