Question
Suppose that Ming and Giorgio both follow the lifecycle hypothesis: in other words, they smooth consumption as much as possible. They each live for 5
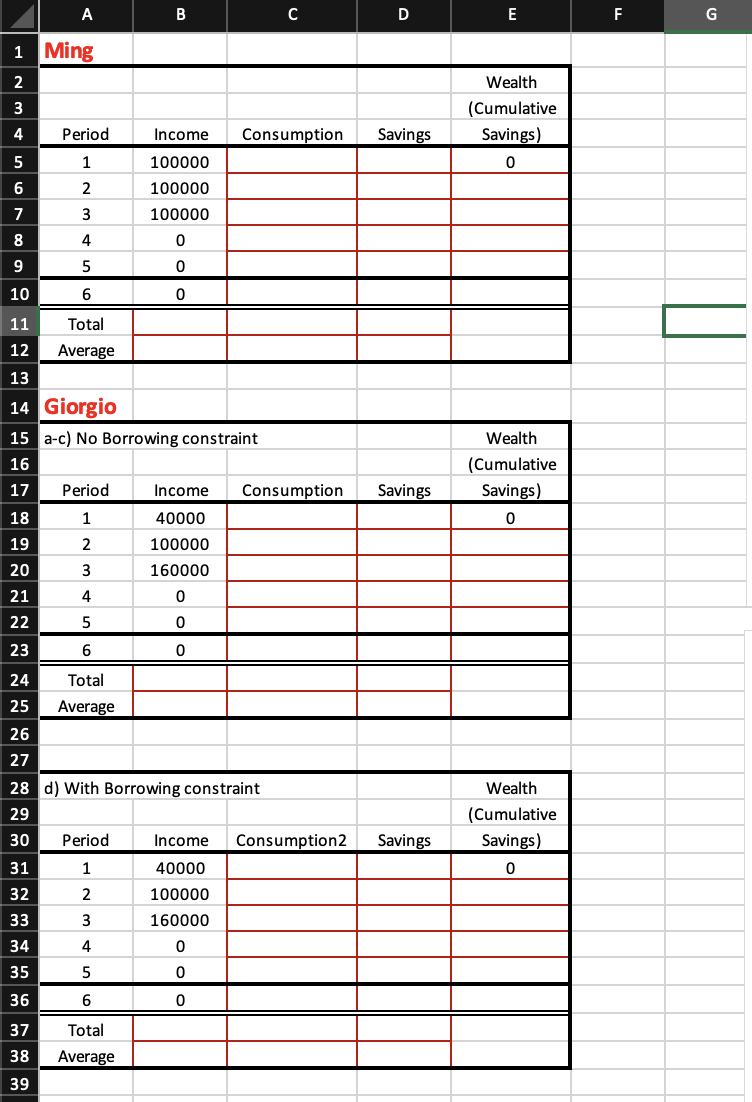
Suppose that Ming and Giorgio both follow the lifecycle hypothesis: in other words, they smooth consumption as much as possible. They each live for 5 periods, the last two of which are retirement. Here are their incomes earned during each period:

They both die at the beginning of period six. To keep things simple, assume that the interest rate is zero for both savings and borrowing, and that their lifespan is perfectly predictable. Only the cells with the red border may be edited. As you enter either numbers or formulas into the cells, the graphs *should* update automatically.
1. [2 pts] For each individual, compute their consumption and savings in each period of life.
2. [2 pts] Compute their wealth (that is the accumulated saving) at the beginning of each period, including period 6. What are their individual (accumulated) wealth at the beginning of period 3, and at the beginning of period 6?
3. [6 pts] Graph consumption, income and wealth for each of them with the period on the horizontal axis ( one graph for Ming and another for Giorgio). Include the plots for each person in your submission.
4. [5 pts] Suppose that consumers cannot borrow so wealth cannot be negative (i.e. they are subject to a borrowing constraint). How does that change your answers above? Draw a new graph for part c if necessary.

Step by Step Solution
There are 3 Steps involved in it
Step: 1

Get Instant Access to Expert-Tailored Solutions
See step-by-step solutions with expert insights and AI powered tools for academic success
Step: 2

Step: 3

Ace Your Homework with AI
Get the answers you need in no time with our AI-driven, step-by-step assistance
Get Started


