Question
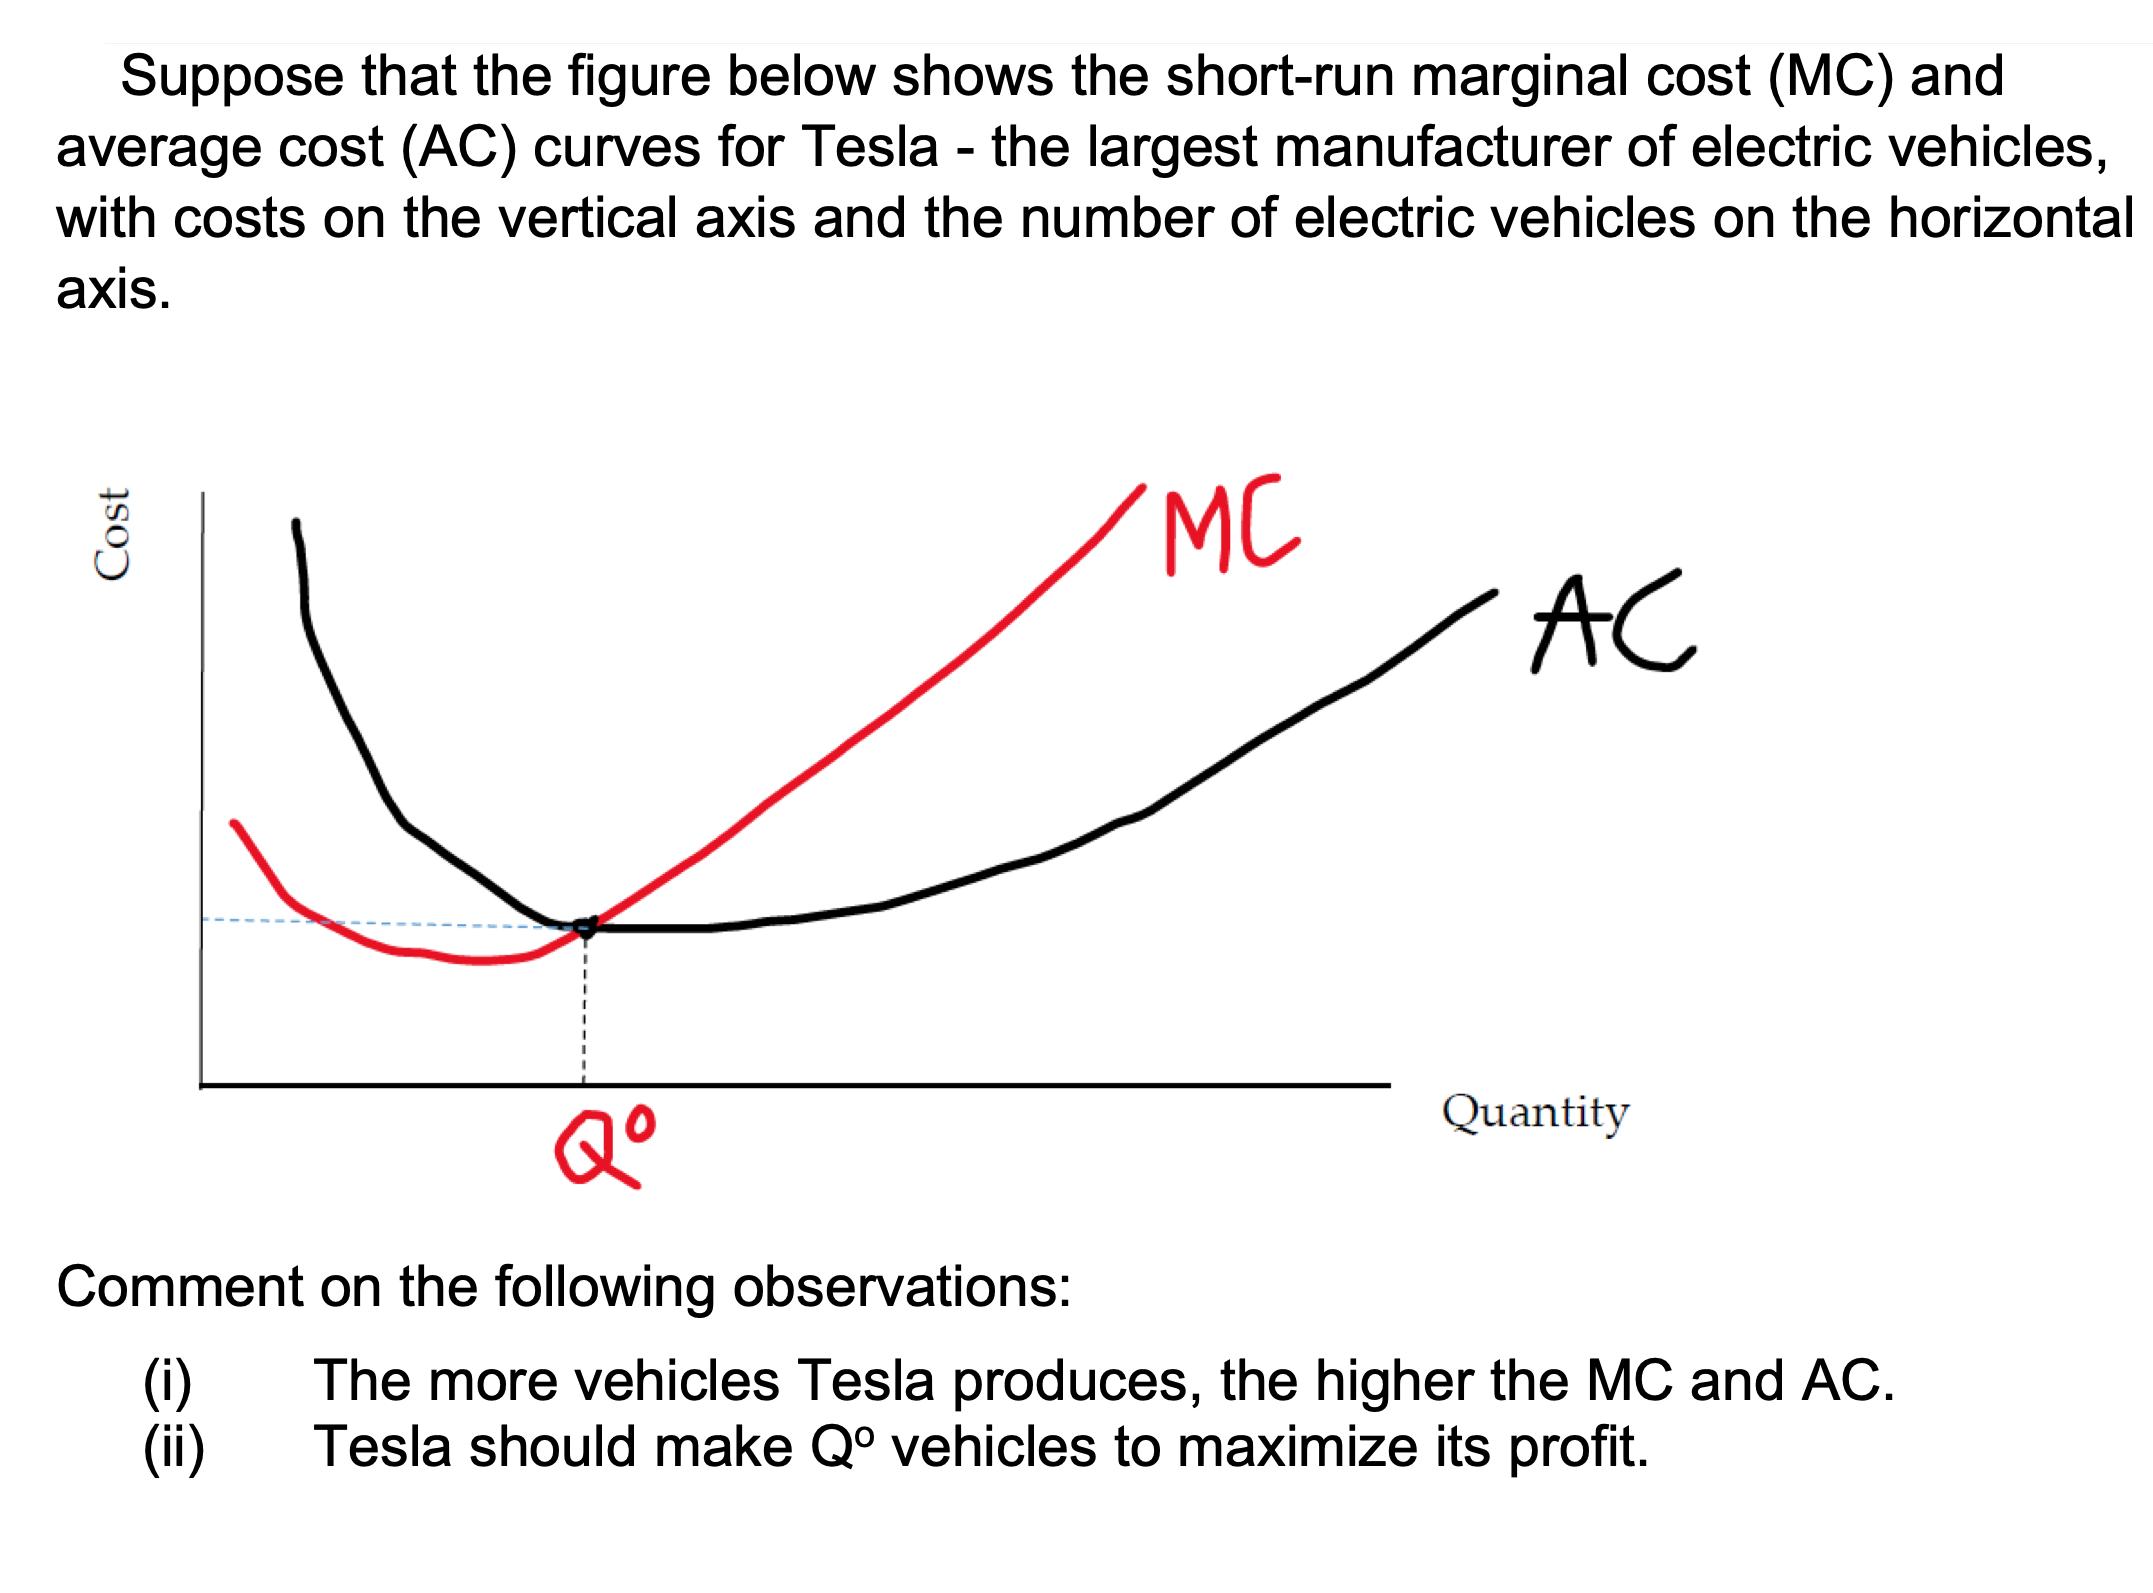
Suppose that the figure below shows the short-run marginal cost (MC) and average cost (AC) curves for Tesla - the largest manufacturer of electric

Suppose that the figure below shows the short-run marginal cost (MC) and average cost (AC) curves for Tesla - the largest manufacturer of electric vehicles, with costs on the vertical axis and the number of electric vehicles on the horizontal axis. Cost Q MC AC Quantity Comment on the following observations: (i) (ii) The more vehicles Tesla produces, the higher the MC and AC. Tesla should make Q vehicles to maximize its profit.
Step by Step Solution
There are 3 Steps involved in it
Step: 1

Get Instant Access to Expert-Tailored Solutions
See step-by-step solutions with expert insights and AI powered tools for academic success
Step: 2

Step: 3

Ace Your Homework with AI
Get the answers you need in no time with our AI-driven, step-by-step assistance
Get StartedRecommended Textbook for
Economics
Authors: Michael Parkin
14th Global Edition
1292433639, 978-1292433639
Students also viewed these Economics questions
Question
Answered: 1 week ago
Question
Answered: 1 week ago
Question
Answered: 1 week ago
Question
Answered: 1 week ago
Question
Answered: 1 week ago
Question
Answered: 1 week ago
Question
Answered: 1 week ago
Question
Answered: 1 week ago
Question
Answered: 1 week ago
Question
Answered: 1 week ago
Question
Answered: 1 week ago
Question
Answered: 1 week ago
Question
Answered: 1 week ago
Question
Answered: 1 week ago
Question
Answered: 1 week ago
Question
Answered: 1 week ago
Question
Answered: 1 week ago
Question
Answered: 1 week ago
Question
Answered: 1 week ago
Question
Answered: 1 week ago
View Answer in SolutionInn App


