

Question
Suppose that the Home Depot Inc. purchased (and received) the merchandize on credit from its supplier. The payment is due in less than 90 days.
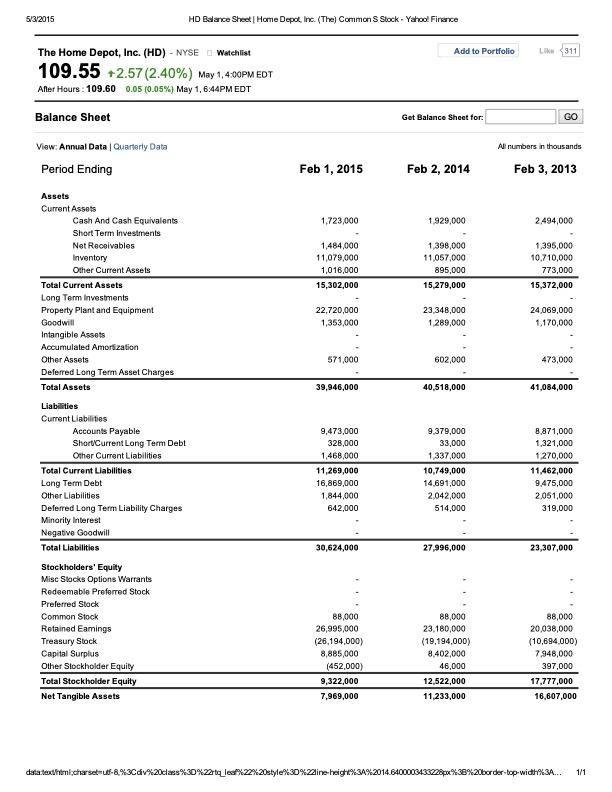
Suppose that the Home Depot Inc. purchased (and received) the merchandize on credit from its supplier. The payment is due in less than 90 days. All else equal, what effect did this transaction have on Home Depot's current ratio? (Use the values from the financial statements for the most recent year.)
a) increased
b) decreased
c) stayed the same
d) There is not enough information to answer this question.
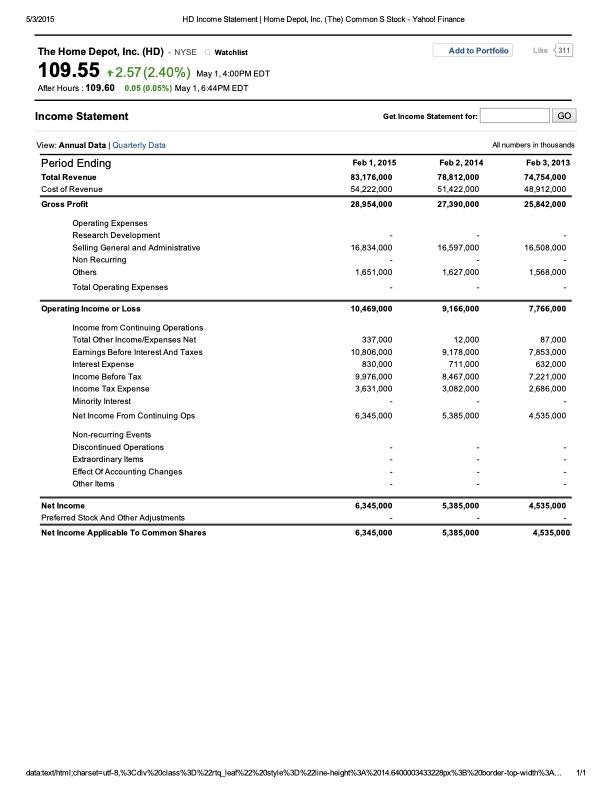
What is the Home Depot's return on assets (ROA)? Comment on the Home Depot's ROA if the industry average is 17%. (Use the values from the financial statements for the most recent year.)
a) 14.44%, worse
b)15.88%, worse
c)16,53%, better
d) 17.85%, better
5/3/2015 HD Balance Sheet Home Depot, Inc. (The) Common S Stock - Yahoo Finance Add to Portfolio Like 311 The Home Depot, Inc. (HD) - NYSE Watchlist 109.55 +2.57 (2.40%) May 1, 4:00PM EDT After Hours : 109.60 0.05 (0.05%) May 1, 6:44PM EDT Balance Sheet Get Balance Sheet for: GO Al numbers in thousands View: Annual Data Quarterly Data Period Ending Feb 1, 2015 Feb 2, 2014 Feb 3, 2013 1.723,000 1.929,000 2.494,000 1,484,000 11,079,000 1,016,000 15,302,000 1,398,000 11,057,000 895,000 15,279,000 1,395,000 10,710,000 773,000 15,372,000 Assets Current Assets Cash And Cash Equivalents Short Term Investments Net Receivables Inventory Other Current Assets Total Current Assets Long Term Investments Property Plant and Equipment Goodwill Intangible Assets Accumulated Amorization Other Assets Deferred Long Term Asset Charges Total Assets 22,720,000 1,353,000 23,348,000 1.289,000 24,069,000 1,170,000 571,000 602,000 473,000 39,946,000 40,518,000 41,084,000 Liabilities Current Liabilities Accounts Payable Short Current Long Term Debt Other Current Liabilities Total Current Liabilities Long Term Debt Other Liabilities Deferred Long Term Liability Charges Minority interest Negative Goodwill Total Liabilities 9,473,000 328.000 1,468,000 11,269,000 16,869,000 1,844,000 642.000 9,379,000 33,000 1,337,000 10.749,000 14.691,000 2,042,000 514,000 8,871,000 1,321,000 1,270,000 11,462,000 9,475,000 2,051,000 319,000 30,624,000 27,996,000 23,307,000 Stockholders' Equity Misc Stocks Options Warrants Redeemable Preferred Stock Preferred Stock Common Stock Retained Eamings Treasury Stock Capital Surplus Other Stockholder Equity Total Stockholder Equity Net Tangible Assets 88,000 26,995,000 (26,194,000) 8,885,000 (452.000) 9,322,000 7,969,000 88,000 23.180,000 (19,194,000) 8.402,000 46,000 12,522,000 11,233,000 88,000 20,038,000 (10,694.000) 7.948,000 397,000 17.777,000 16,607,000 data.html.charsetutf-8.%3Cdiv%20class%3D%22rt_les22%20style%30% line-height%3A%2014.8400003433728px %38%20border-top-width%3A... 1/1 5/3/2015 HD Income Statement Home Depot, Inc. (The) Common S Stock - Yahool Finance Add to Portfolio Like 311 The Home Depot, Inc. (HD) - NYSE Watchlist 109.55 +2.57 (2.40%) May 1, 4:00PM EDT After Hours : 109.60 0.05 (0.05%) May 1, 6:44PM EDT Income Statement Get Income Statement for: GO All numbers in thousands View: Annual Data Quarterly Data Period Ending Total Revenue Cost of Revenue Gross Profit Feb 1, 2015 83.176,000 54 222,000 28.954,000 Feb 2, 2014 78.812,000 51.422,000 27,390,000 Feb 3, 2013 74,754,000 48.912.000 25,842,000 16,834,000 16,597,000 16,508,000 1,651,000 1.627,000 1.568,000 10,469,000 9,166,000 7,766,000 Operating Expenses Research Development Selling General and Administrative Non Recurring Others Total Operating Expenses Operating Income or Loss Income from Continuing Operations Total Other Income Expenses Net Earnings Before Interest And Taxes Interest Expense Income Before Tax Income Tax Expense Minority Interest Net Income From Continuing Ops Non-recurring Events Discontinued Operations Extraordinary Items Effect of Accounting Changes Other items 337,000 10,806,000 830,000 9.976,000 3,631,000 12,000 9,178,000 711,000 8,467,000 3,082,000 87.000 7.853,000 632.000 7221.000 2.686,000 6,345,000 5,385,000 4,535,000 6,345,000 5,385,000 4,535,000 Net Income Preferred Stock And Other Adjustments Net Income Applicable To Common Shares 6,345,000 5,385,000 4,535,000 data tenthel charset=utf-8.%3Cdiv%20class%3D%22rt2_leaf_22%20style%3D%22ine-height%3A%201464000034332280x%3B%20border-top-width%3A. 1/1Step by Step Solution
There are 3 Steps involved in it
Step: 1

Get Instant Access to Expert-Tailored Solutions
See step-by-step solutions with expert insights and AI powered tools for academic success
Step: 2

Step: 3
Ace Your Homework with AI
Get the answers you need in no time with our AI-driven, step-by-step assistance
Get Started
Handbook Of Frontier Markets Evidence From Middle East North Africa And International Comparative Studies
Authors: Panagiotis Andrikopoulos , Greg N. Gregoriou , Vasileios Kallinterakis
1st Edition
0128092009,0128094915